2. 上海海洋大学海洋科学学院, 上海 201306
2. College of Marine Sciences, Shanghai Ocean University, Shanghai 201306, China
短尾大眼鲷(Priacanthus macracanthus)属于大眼鲷科(Priacanthidae)大眼鲷属, 广泛分布于中国沿岸海区, 属于暖水性底层鱼类, 其中南海北部海域是其渔场的主要分布地区[1]。近年来随着捕捞渔获物结构发生变化, 其在近岸捕捞渔获中的比例不断升高, 占总渔获量的比例稳定在30%左右[2], 是南海区近岸海域主要经济物种之一, 具有较高的经济价值和生态意义[3]。国内外学者对短尾大眼鲷生活史[4-6]、摄食[7]、生长死亡参数[8-9]、种群遗传结构[10-12]等方面进行了研究, 但针对其渔场及环境因子的研究较少, 特别是结合水深因子(depth, D)分析渔场与海表温(sea surface temperature, SST)的关系尚不多见。
灰色关联度分析[13]和一元非线性回归分析[14]广泛应用于社会和自然学科的各个领域, 如农业、渔业、教育、卫生等。灰色关联度分析是衡量因素间关联程度的一种方法, 通过序列曲线之间的相关程度来判断其联系是否紧密; 通过关联度数值的大小可以判断产生影响的重要因素和非重要因素。环境变量与渔场之间的关系通常为非线性关系, 因此非线性回归能够较好地描述渔场与环境变量之间的关系。为此本研究根据南海北部200 m以浅海域渔业资源调查数据, 综合SST和D, 分析渔场的时空变化与海洋环境因子的关系, 为南海北部短尾大眼鲷的资源评价与渔场判别提供依据。
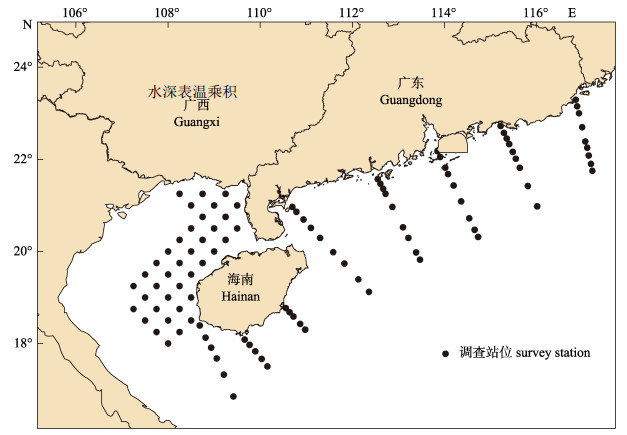
1 材料与方法 1.1 数据来源渔场数据来自2014—2017年南海北部近海渔业资源调查8个航次的底拖网调查, 按年分为春、夏、秋、冬4个季度, 春季调查为4—5月, 夏季调查为7—8月, 秋季调查为10—11月, 冬季调查为1—2月, 每个季度调查2个航次。调查船为“桂北渔60011”, 船长36.8 m, 宽6.8 m, 吨位242 t, 功率441 kW, 底拖网网具尺寸为80.4 m×60.54 m。调查范围为南海北部近岸区域200 m等深线以浅海域, 共布设99个站位(图 1), 每个站位拖网1 h, 数据包含拖网日期、经纬度、水深、渔获物种类、数量等。
|
图 1 本研究调查站位 Fig.1 Survey stations in the present study |
SST数据来自美国国家海洋和大气管理局网站(http://coastwatch.pfeg.noaa.gov/erddap/info/)卫星遥感数据, 空间分辨率为4 km, 选取拖网当天的数据。
1.2 数据处理方法按照站位统计渔场数据, 以单位捕捞努力量(catch per unit effect, CPUE)作为表征渔场质量的指标量[15], CPUE高于当季调查CPUE的前30%的区域认为渔场较好, 低于当季调查CPUE的后30%认为渔场较差。
| ${\rm{CPUE}} = Y/T $ |
式中, Y为该站点的渔获量(kg), T为该站点的拖网时间(h), CPUE单位为kg/h。
SST数据按照调查时间与调查站位进行匹配, 采用频次分析法分析SST与CPUE的关系; 水深数据采用现场测量数据, 单位m, 分析调查水深与CPUE的关系; 将各站位SST与水深D相乘, 得到新的变量(SSTD), 作为表示温度在海洋内部变化的变量, 与SST和D等数据一起分析与CPUE的关系。此变量可将SST与D相结合, 只采用一个可变化的SST与相对地理位置固定的D结合, 更简洁直观反映渔场与SST和水深的关系。
1.3 模型构建运用灰色关联度分析[13], 研究不同季节CPUE与D、SST、SSTD的关联度, 并选取关联度最高的因子作为建模因子带入下一步建模中。先分别计算各原始数据的平均数, 再用各组原始数据除以该平均数, 得到一个各个数据相对于平均数倍数的均值化数列; 采用比较数列与参考数列各个时期的关联系数的平均值来定量反映这两个数列的关联程度, 其计算公式为:
| ${\delta _k}(t) = \frac{{{\Delta _{\min }} + \rho {\Delta _{\max }}}}{{{\Delta _{k(t)}} + \rho {\Delta _{\max }}}} $ |
| ${r_k} = \frac{1}{n}\mathop \sum \limits_{i = 1}^n {\delta _k}(t) $ |
式中, rk为关联度; ρ为分辨系数, 取0.5; △k(t)为各期数值与参考数列的差值绝对值; △min和△max分别为所有比较数列在各期的差值绝对值中的最小值和最大值。
按照季节, 将各季节CPUE进行标准化处理, 各季节CPUE最高时认为CPUE为1, CPUE最低时认为CPUE为0;标准化CPUE的计算公式如下[16]:
| ${\rm{CPU}}{{\rm{E}}_{i}}{\rm{ = }}\frac{{{\rm{CPUE}}}}{{{\rm{CPU}}{{\rm{E}}_{{\rm{max}}}}}} $ |
式中, CPUEi为i季得到的标准CPUE; CPUEmax为i季的最大单位捕捞努力量渔获量。采用一元非线性回归, 建立标准化后的CPUEi与关联度最高的因子之间的关系, 以此来分析渔场的时空变化, 一元非线性回归模型形式如下:
| ${\rm{CPU}}{{\rm{E}}_i}{\rm{ = }}{(a - b \times M)^c} $ |
式中, a、b、c均为模型系数, M为各季节SST、D、SSTD中关联度最高的因子。
对各季节模型理论CPUEi结果进行克里格插值[17-18], 并与实际CPUE进行叠加分析, 克里格插值采用普通克里格插值, 定量分析渔场分布特征, 根据插值给出最优的无偏估计, 同时提供估计值的误差和精准度, 其实质是局部估计的加权平均值:
| ${Z_\gamma } = \mathop \sum \limits_{i = 1}^n {\sigma _i}Z({x_i}) $ |
式中, Zγ为理论CPUE的插值结果, σi是与CPUE实际值Z(xi)有关的加权系数, 对于给定的一组数据信息Z(xi), 存在一组σi使得估计方差最小, 则该区域的理论CPUEi插值真值在最小可能的置信区间内产生。
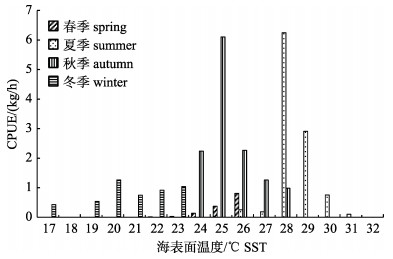
2 结果与分析 2.1 CPUE与SST的关系不同季节CPUE与SST的关系如图 2所示, 各季节CPUE均随SST的升高呈现先升高后降低的趋势, 其中春季CPUE最高时SST为26℃, 夏季CPUE最高时SST为28℃, 秋季CPUE最高时SST为25℃, 冬季CPUE最高时SST为20℃。
|
图 2 南海北部海域短尾大眼鲷不同季节单位捕捞努力量渔获量(CPUE)与海表面温度(SST)的关系 Fig.2 Relationship of Priacanthus macracanthus CPUE and SST in different seasons in the northern South China Sea |
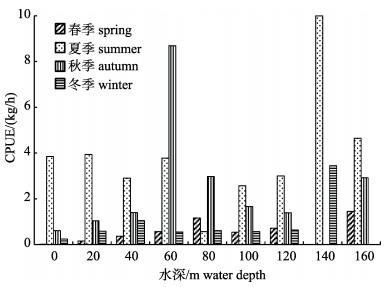
以水深20 m为间隔, 分析不同季节CPUE与调查站位水深的关系(图 3), 结果发现, 春季CPUE随水深加深有增大趋势, 160 m处CPUE最大; 夏季CPUE随水深变化较小, 在140 m水深处达到最大值; 秋季CPUE随水深呈先增大后减小的趋势, 在水深60 m处达到最大; 冬季CPUE随水深增大呈增加趋势, 在140 m处达到最大。
|
图 3 南海北部海域短尾大眼鲷不同季节CPUE与水深(D)的关系 Fig.3 Relationship of Priacanthus macracanthus CPUE and depth (D) in different seasons in the northern South China Sea |
各季节CPUE分别与水深, SST, SSTD进行灰色关联度分析, 分辨系数ρ取0.5, 结果见表 1。
|
|
表 1 南海北部海域短尾大眼鲷各季节CPUE与水深、表温、水深表温乘积的关联度 Tab.1 The correlation of Priacanthus macracanthus CPUE and D, SST, and product of D and SST (SSTD) in each season in the northern South China Sea |
从上表中可看出, 各季节CPUE均与SSTD关联度最高, 因此将SSTD作为环境因子带入下一步的分析建模中。
2.3.2 模型的建立采用一元非线性回归, 建立各季节CPUE与SSTD的关系模型, 结果如表 2所示。
|
|
表 2 南海北部海域短尾大眼鲷各季节CPUE与SSTD的关系模型 Tab.2 The Priacanthus macracanthus CPUE and product of D and SST (SSTD) relation models in each season in the northern South China Sea |
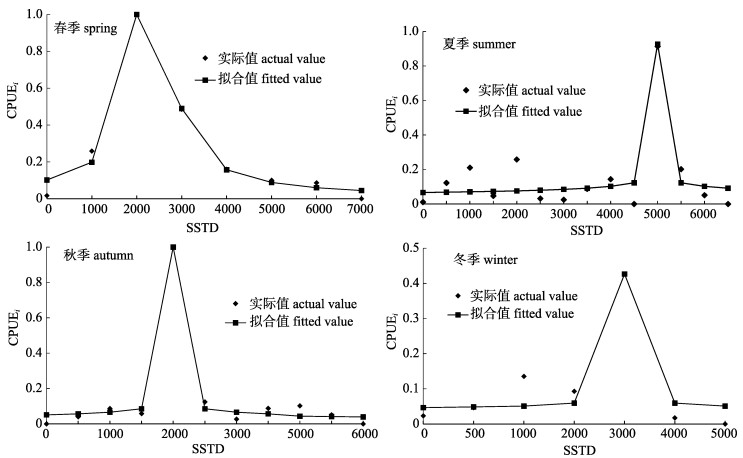
结合表 2与图 4可知, 对表 2的各模型求1阶导数即可获得各季节的最适SSTD的取值, 春季最适SSTD为2084, 夏季最适SSTD为4997, 秋季最适SSTD为2132, 冬季最适SSTD为3235, 全年最适SSTD的变化呈明显的单峰分布趋势。各季节模型P值均小于0.05, 模型拟合准确。
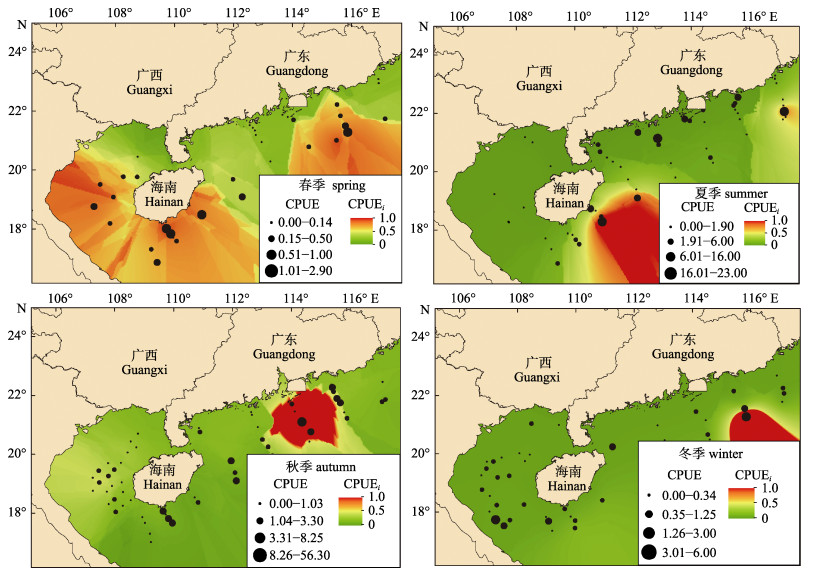
2.3.3 模型分析对各季节模型的理论值CPUEi进行普通克里格插值, 并叠加相应季节的CPUE实际值进行分析(图 5), 结果表明, CPUEi和CPUE实际值分布均有明显的季节变化。春季CPUEi高值区(CPUEi > 0.5)分布较广, 主要集中在海南岛南部海域和珠江口外海海域; 夏季CPUEi高值区分布于海南岛东南部海域和汕头东部外海海域; 秋季CPUEi高值区分布于珠江口外海海域和北部湾中部海域; 冬季CPUEi高值区分布于珠江口东南外海海域。
|
图 4 南海北部海域短尾大眼鲷各季节CPUE模型拟合值与实际值 Fig.4 The fitting values and actual values of each model in each season in the northern South China Sea of Priacanthus macracanthus |
|
图 5 南海北部海域短尾大眼鲷各季节CPUEi与CPUE分布 Fig.5 Distribution of CPUEi and CPUE in each season in the northern South China Sea of Priacanthus macracanthus |
CPUE分布具有明显的季节变化, 春季CPUE高值区主要分布于海南岛东南侧和汕头外海海域; 夏季CPUE高值区主要分布于海南岛东南侧和广东省近岸海域; 秋季CPUE高值区主要分布于珠江口外海海域; 冬季CPUE较低, 高值区主要分布于北部湾南部和汕头外海海域。CPUE高值区的分布与HSI高值区分布一致, 模型预测准确。
3 讨论该研究分析了南海北部短尾大眼鲷渔场的分布及其与海表温和水深因子的关系, 并首次将SSTD因子引入到渔场分析中, 研究水深与表温的共同作用下渔场的分布规律, 进一步阐明了CPUE分布是水深与温度综合作用的结果, 为进一步研究渔场形成规律和渔场判别奠定了基础。
3.1 短尾大眼鲷渔场的分布短尾大眼鲷在南海北部近海分布广泛, 不同季节渔场呈现不同分布趋势。其中夏秋季分布模式接近, 与冬春季有明显不同(图 5), 渔场在夏秋季分布较冬春季更为分散, 且CPUE明显高于冬春季, 这可能与其多在夏季产卵的生物学特性有关[19-20]。另外该研究发现, 南海北部的大眼鲷渔场呈明显的斑块状分布, 与传统假定渔场呈均匀分布有较大不同[4, 21], CPUE高值区分布往往较为集中, 而大部分海区CPUE较低, 具有一定的集群性特点。
结合各季节最适SSTD来看, 短尾大眼鲷春秋季渔场的特点较为一致, 夏季SSTD最大, 说明在SST较高时, 短尾大眼鲷多分布于水深较深的海域; 而秋季最适SSTD较小, 说明在秋季短尾大眼鲷分布于水深较浅处; 冬季SSTD位于秋季和夏季中间, 但冬季SST较低, 说明冬季其栖息水深比秋季要深; 这从另一个角度解释了不同季节的渔场分布差异。
3.2 渔场形成机制分析从渔场分布来看, 冬春季渔场多分布于离岸较近的海域, 夏秋季离岸较远, 这可能与温度与饵料生物分布的季节变化有关[20, 22-23], 冬春季海水温度较低, 其主要饵料生物虾类、头足类幼体等[7]分布受叶绿素分布的影响离岸较近, 故CPUE高值区主要集中于近岸海域; 而夏秋季海水温度升高, 叶绿素高值区向离岸方向移动, 故而CPUE高值区主要分布于水深较深的离岸海域。另一方面短尾大眼鲷渔场的分布也易受海水中溶解氧浓度的影响[20]。
南海北部近岸海域, 除受海洋环境因素影响较多外, 受人为活动和天气变化过程影响也不可忽视,特别是近年来近岸的海岸工程建设, 人工鱼礁建设等进一步影响了近岸渔场的分布, 其中对短尾大眼鲷的鱼卵、仔稚鱼的分布影响较大, 而鱼卵、仔稚鱼的时空变动进一步影响了短尾大眼鲷渔场的变化。
3.3 模型准确性从模型本身和插值结果进行准确性的检验, 采用交叉验证法[14, 18]对模型和插值效果进行评价, 其R2=0.67, 可以解释大多数变量的变化, 可以认为模型本身和插值结果是恰当的。
根据已建立的栖息地指数模型, 将各季节模型的预测值与实际值进行比较, 预测值与理论值之差小于0.4则认为模型准确, 反之认为模型不准确[24-27], 其结果如表 3, 平均准确率为75%, 表明所建立的模型能够有效解释渔场分布与所选环境因子之间的关系。
|
|
表 3 标准化与水深表温乘积关系模型的准确性分析 Tab.3 Accuracy analysis of CPUEi and SSTD model |
本研究采用了8个航次的调查数据, 涵盖了4年, 每个季度2次调查, 数据具有一定的代表性, 但其时间序列仍不够长, 存在一定的偶然性与不确定性, 数据易受台风等气候事件和偶然捕获等影响[5, 22, 28]。另外本研究仅将SST与水深D进行简单的相乘, 因子的处理较为简单, 未能反映其内在物理海洋的变化原因, 在今后的研究中应进一步探索渔场与其他环境因子, 环境因子自身在海水中垂直变化等各种海洋环境要素的关系。
| [1] |
Sun D R, Lin Z J. Variations of major commercial fish stocks and strategies for fishery management in Beibu Gulf[J]. Journal of Tropical Oceanography, 2004, 23(2): 62-68. [孙典荣, 林昭进. 北部湾主要经济鱼类资源变动分析及保护对策探讨[J]. 热带海洋学报, 2004, 23(2): 62-68. DOI:10.3969/j.issn.1009-5470.2004.02.008] |
| [2] |
Ju P L. Study on the changes of the ecological character-istics of four species of fish in the Taiwan Strait and its adjacent waters[D]. Xiamen: Xiamen University, 2015: 47-56. [鞠培龙.台湾海峡及其邻近海域四种底层及近底层鱼类生态学特征变化的研究[D].厦门: 厦门大学, 2015: 47-56.]
|
| [3] |
Chen G B, Li Y Z, Zhao X Y, et al. Acoustic assessment of five groups commercial fish in South China Sea[J]. Acta Oceanologica Sinica, 2006, 28(2): 128-134. [陈国宝, 李永振, 赵宪勇, 等. 南海5类重要经济鱼类资源声学评估[J]. 海洋学报, 2006, 28(2): 128-134. DOI:10.3321/j.issn:0253-4193.2006.02.016] |
| [4] |
Lu Z B, Dai Q S, Yan Y M. A study of population dy-namics of major benthic commercial fishes in Fujian coastal waters[J]. Journal of Oceanography in Taiwan Strait, 1999, 18(1): 100-105. [卢振彬, 戴泉水, 颜尤明. 福建近海主要底层经济鱼类的种群动态[J]. 台湾海峡, 1999, 18(1): 100-105. DOI:10.3969/j.issn.1000-8160.1999.01.018] |
| [5] |
Jabbar M A, Kamal M M, Boer M, et al. Population dynam-ics of the red bigeye (Priacanthus macracanthus Cuvier, 1829) (Fish:Family Priacanthidae) in Palabuhanratu Bay, Indonesia[J]. Aquaculture, Aquarium, Conservation & Leg-islation, 2017, 10(5): 1198-1209. |
| [6] |
Joung S J, Chen C T. Age and growth of the big eye Pria-canthus macracanthus from the surrounding water of Guei-Shan Island, Taiwan[J]. Nippon Suisan Gakkaishi, 1992, 58(3): 481-488. DOI:10.2331/suisan.58.481 |
| [7] |
Lu Z H, Zhu Z J, Lin X P. Food habits of Priacanthus macracanthus in East China Sea region[J]. Marine Fisheries, 2010, 32(2): 199-203. [卢占晖, 朱增军, 林显鹏. 东海区短尾大眼鲷的食性分析[J]. 海洋渔业, 2010, 32(2): 199-203. DOI:10.3969/j.issn.1004-2490.2010.02.014] |
| [8] |
Sun D R, Qiu Y S. Estimation of growth and mortality pa-rameters of Priacanthus macracanthus in the north conti-nental shelf of South China Sea[J]. Journal of Zhanjiang Ocean University, 2004, 24(1): 28-34. [孙典荣, 邱永松. 南海北部大陆架短尾大眼鲷生长和死亡参数估计[J]. 湛江海洋大学学报, 2004, 24(1): 28-34. DOI:10.3969/j.issn.1673-9159.2004.01.005] |
| [9] |
Zhang K, Chen Z Z, Wang Y Z, et al. Population structure of Priacanthus macracanthus in the Beibu Gulf, and parameters for its growth, morality and maturity[J]. Journal of Tropical Oceanography, 2016, 35(5): 20-28. [张魁, 陈作志, 王跃中, 等. 北部湾短尾大眼鲷群体结构及生长、死亡和性成熟参数估计[J]. 热带海洋学报, 2016, 35(5): 20-28.] |
| [10] |
Ju P L, Yang L, Lu Z B, et al. Age, growth, mortality and population structure of silver croaker Pennahia argentata (Houttuyn, 1782) and red bigeye Priacanthus macra-canthus (Cuvier, 1829) in the north-central Taiwan Strait[J]. Journal of Applied Ichthyology, 2016, 32(4): 652-660. DOI:10.1111/jai.2016.32.issue-4 |
| [11] |
Xiong D, Li M, Chen Z Z, et al. Genetic structure of Pria-canthus macracanthus population from the South China Sea[J]. South China Fisheries Science, 2015, 11(2): 27-34. [熊丹, 李敏, 陈作志, 等. 南海短尾大眼鲷的种群遗传结构分析[J]. 南方水产科学, 2015, 11(2): 27-34.] |
| [12] |
Xiong D, Li M, Li Y Z, et al. Sequence analysis of the mito-chondrial cytochrome b and identification of the Priacanthus macracanthus population in the South China Sea[J]. Journal of Fishery Sciences of China, 2016, 23(1): 188-197. [熊丹, 李敏, 李永振, 等. 南海短尾大眼鲷线粒体Cyt b基因序列及种群判别分析[J]. 中国水产科学, 2016, 23(1): 188-197.] |
| [13] |
Chen X J. Application of Grey System Theory in Fishery Science[M]. Beijing: China Agriculture Press, 2003: 23-28. [陈新军. 灰色系统理论在渔业科学中的应用[M]. 北京: 中国农业出版社, 2003: 23-28.]
|
| [14] |
Du R Q. Biostatistics[M]. Beijing: Higher Education Press, 2003: 78-92. [杜荣骞. 生物统计学[M]. 北京: 高等敎育出版社, 2003: 78-92.]
|
| [15] |
Fan J T, Chen G B, Chen Z Z. Forecasting fishing ground of calamary in the northern South China Sea according to habitat suitability index[J]. South China Fisheries Science, 2017, 13(4): 11-16. [范江涛, 陈国宝, 陈作志. 基于栖息地指数的南海北部枪乌贼渔情预报模型构建[J]. 南方水产科学, 2017, 13(4): 11-16. DOI:10.3969/j.issn.2095-0780.2017.04.002] |
| [16] |
Fan J T, Chen Z Z, Zhang J, et al. Sthenoteuthis oualaniensis fishing grounds analysis based on marine environmental factors and different weight coefficients in the Zhongxisha and Xisha Islands, South China Sea[J]. South China Fisheries Science, 2016, 12(4): 57-63. [范江涛, 陈作志, 张俊, 等. 基于海洋环境因子和不同权重系数的南海中沙西沙海域鸢乌贼渔场分析[J]. 南方水产科学, 2016, 12(4): 57-63. DOI:10.3969/j.issn.2095-0780.2016.04.007] |
| [17] |
Fan J T, Zhang J, Feng X, et al. Analysis of Sthenoteuthis oualaniens fishing grounds in Nansha sea area based on geostatistics[J]. Chinese Journal of Ecology, 2017, 36(2): 442-446. [范江涛, 张俊, 冯雪, 等. 基于地统计学的南沙海域鸢乌贼渔场分析[J]. 生态学杂志, 2017, 36(2): 442-446.] |
| [18] |
Wang Z Q. Geostatistics and Its Application in Ecology[M]. Beijing: Science Press, 1999: 38-55. [王政权. 地统计学及在生态学中的应用[M]. 北京: 科学出版社, 1999: 38-55.]
|
| [19] |
Liu K M, Hung K Y, Chen C T. Reproductive biology of the big eye Priacanthus macracanthus in the north-eastern waters off Taiwan[J]. Fisheries Science, 2001, 67(6): 1008-1014. DOI:10.1046/j.1444-2906.2001.00355.x |
| [20] |
Liu K M, Chen C T, Joung S J. Some aspects on the fishery biology of big eye Priacanthus macracanthus in the Tungkang waters, southwestern Taiwan[J]. Journal of Tai-wan Fisheries Association, 1992, 19(4): 251-262. |
| [21] |
Zhang J, Yao Z, Lin L S, et al. Spatial distribution of bio-mass and fishery biology of main commercial fish in the mouth of Beibu Bay and the southwestern waters of the Nansha Islands[J]. Periodical of Ocean University of China, 2016, 46(11): 158-167. [张静, 姚壮, 林龙山, 等. 北部湾口和南沙群岛西南部海域主要渔获种类的生物学特征及其数量分布[J]. 中国海洋大学学报:自然科学版, 2016, 46(11): 158-167.] |
| [22] |
Lu H J, Lee H L. Changes in the fish species composition in the coastal zones of the Kuroshio Current and China Coastal Current during periods of climate change:Observa-tions from the set-net fishery (1993-2011)[J]. Fisheries Research, 2014, 155(4): 103-113. |
| [23] |
Hsieh C H, Chiu T S. Summer spatial distribution of cope-pods and fish larvae in relation to hydrography in the northern Taiwan Strait[J]. Zoological Studies, 2004, 41(1): 85-98. |
| [24] |
Chen X J, Tian S Q. Study on the catch distribution and relationship between fishing ground and surface tem-perature for Ommastrephes Bartrami in the Northwestern Pacific Ocean[J]. Journal of Ocean University of China:Natural Science, 2005, 35(1): 101-107. |
| [25] |
Yu W, Chen X J, Yi Q, et al. Variability of suitable habitat of western winter-Spring cohort for neon flying squid in the Northwest Pacific under anomalous environments[J]. PLoS ONE, 2015, 10(4): e0122997. DOI:10.1371/journal.pone.0122997 |
| [26] |
Zainuddin M, Saitoh K, Saitoh S I. Albacore (Thunnus alalunga) fishing ground in relation to oceanographic conditions in the western North Pacific Ocean using remotely sensed satellite data[J]. Fisheries Oceanography, 2008, 17(2): 61-73. DOI:10.1111/j.1365-2419.2008.00461.x |
| [27] |
Zhu J, Xu J, Zhang C, et al. Marine fishing ground prediction based on Bayesian decision tree model[C]//Proceedings of the 2017 International Conference on Management Engineering, Software Engineering and Service Sciences. New York: ACM Press, 2017: 316-320.
|
| [28] |
Alabia I D, Saitoh S I, Mugo R, et al. Seasonal potential fishing ground prediction of neon flying squid (Ommastrephes bartramii) in the western and central North Pa-cific[J]. Fisheries Oceanography, 2015, 24(2): 190-203. DOI:10.1111/fog.2015.24.issue-2 |
 2019, Vol. 26

