鸢乌贼(Sthenoteuthis oualaniensis)具有生命周期短, 资源储量大等特点[1-2], 据评估春季南海外海鸢乌贼资源量约457×104 t[3]。鸢乌贼是大型钢制罩网渔船在南海外海的主捕鱼种[4], 开发利用其资源对于维护中国南海海洋权益, 缓解近岸捕捞压力具有积极意义。
广义加性模型(GAM)是广义线性模型(GLM)的非参数化拓展, 利用样条函数表示自变量与因变量间的非线性关系, 在渔业研究中已被广泛应用[5-16]。Zagaglia等[7]基于GAM模型研究了巴西延绳钓渔业中黄鳍金枪鱼(Thunnus albacores)单位捕捞努力量渔获量(CPUE)与环境变量间的关系, 发现黄鳍金枪鱼CPUE最大的区域与热带辐合带的位置密切相关。Zainuddin等[8]通过GAM模型与GLM模型结合的方式研究了北太平洋西部海域长鳍金枪鱼(Thunnus alalunga)渔场与海洋水文状况间的关系, 发现海洋涡旋和锋面可能会解释长鳍金枪鱼最高CPUE区域的空间分布。Chiu等[12]利用GAM模型分析了阿根廷滑柔鱼(Illex argentinus) CPUE与各影响因素间的关系, 并识别出阿根廷滑柔鱼在低丰度、高丰度年份的两种独特运动模式。
在南海鸢乌贼CPUE的研究中也广泛用到了GAM模型。晏磊等[17-18]基于GAM模型分别研究了月相、网具沉降性能对CPUE的影响, 招春旭等[19]在GAM模型中选取月相、作业时间作为变量, 范江涛等[20]利用GAM模型研究了鸢乌贼渔场与海洋环境因子间的关系。本研究选取时空因素(经纬度、月)、作业操作要素(月相、作业时间)、海洋环境因素(海表温度SST、0~50 m温度梯度Δ50)等, 模型变量较上述研究更为全面, 且环境数据均为海上实测, 结果有助于更深入了解南海中南部海域鸢乌贼的渔场渔期及CPUE变化特征, 并为南海外海鸢乌贼渔业的发展提供参考资料与技术支持。
1 材料与方法 1.1 数据采集调查渔船为灯光罩网渔船“桂北渔80208”。钢质, 总吨位421 Gt, 总长43.6 m, 型宽7.60 m, 型深4.10 m。渔船主机2台, 每台功率201.0 kW; 电机2台, 每台功率280 kW。罩网的主尺度为281.60 m×81.76 m, 网具沉子纲配重2816 kg, 网衣最大网目35 mm, 网囊最小网目20 mm。
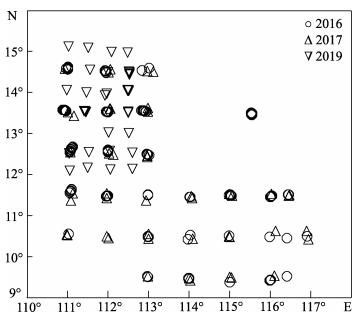
调查时间为2016年3—4月、10—11月, 2017年4—5月、8—9月, 2019年8—9月, 调查海域为南海中南部海域, 站点见图 1。研究数据均为海上实测所得, 共计106 d、336网次, 包括每网次的经纬度、年月、农历日、作业时间、每网次鸢乌贼渔获量等; RBR duo TD绑于网口沉纲处, 实时记录海水温度变化, 测量间隔1 s。
|
图 1 南海中南部海域鸢乌贼调查站点示意图 Fig.1 Survey sites for Sthenoteuthis oualaniensis in central-southern part of South China Sea |
鸢乌贼的CPUE为每网次的渔获量, 单位kg/网。
温度梯度是两层温度之差除以两层距离[21], 单位℃/m。
影响鸢乌贼CPUE的因素可能包括时空因素(经纬度、月)、作业操作要素(月相、作业时间)、海洋环境因素(海表温度SST、0~50 m温度梯度Δ50)。其中, 335网次的沉降深度超过50 m, 选取0~50 m进行温度梯度影响的研究可最大程度保证数据质量。研究数据年份跨度小且不连续, 故未将年作为CPUE的影响因素放入模型。
广义可加模型是广义线性模型的非参数扩展形式, 可模拟各种因素对CPUE的非线性作用。因实验数据中2网次的CPUE为0, 对所有CPUE加上常数[15, 22] 0.1取对数变换, 构建的GAM模型方程如下:
| $ \begin{gathered} \ln ({\text{CPUE}} + 0.1) = s({\text{lon, lat}}) + s(m) + s(l) + s(h) + \hfill \\ \;\;\;\;\;s({\text{SST}}) + s(\Delta 50) \hfill \\ \end{gathered} $ | (1) |
式中, s为自然样条平滑函数; lon表示经度; lat表示纬度; m表示月份; l表示农历日; h表示作业时间; SST表示海表温度; Δ50表示0~50 m温度梯度。
使用单因素方差分析检验不同月份、作业时间、SST范围、Δ50范围及月黑夜与月光夜间的鸢乌贼CPUE有无显著性差异。其中, 根据农历日区分月光夜(初八至廿二)和月黑夜(初一至初七、廿三至三十)[23], SST范围以0.5 ℃为一个区间, Δ50以0.05 ℃/m为一个区间。
数据处理通过Excel 2010、R3.5.3进行。
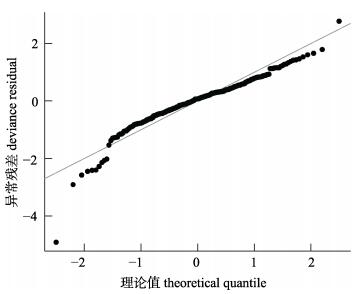
2 结果与分析 2.1 最佳模型模型选择采用AIC值。将所有的因素依次放入GAM模型, 模型统计参数见表 1。随着因素的加入, 模型AIC值不断减小, 方差解释与决定系数不断增大, 且最终各因素均对模型存在显著性影响(表 2),
|
|
表 1 包含不同影响因素GAM模型的统计参数 Tab.1 Statistical characteristics of the GAM models including different influencing factors |
|
|
表 2 最佳GAM模型检验值 Tab.2 F-test for significance of non-parametric effects of the best GAM model |
|
图 2 鸢乌贼最佳GAM模型残差图 Fig.2 Residual plot of the best GAM model |
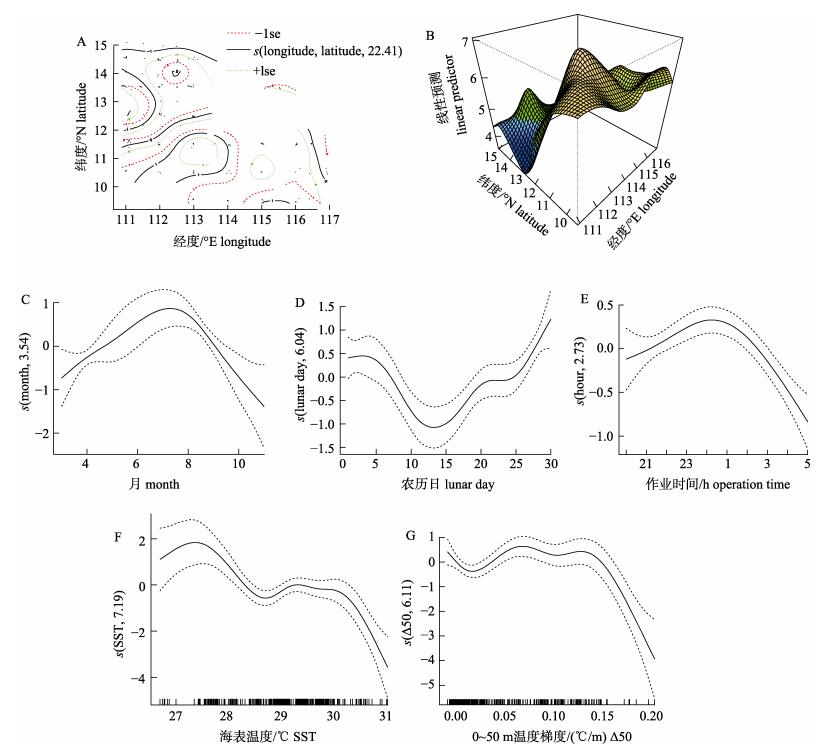
经纬度的方差解释率在所有变量中最高, 为18%。图 10A中带有标记1或0的黑色实线[15]表明, 鸢乌贼CPUE较高的区域主要有三处, 分别位于10°N~12°N、112°E~114°E, 9°30′N、115°E~116°E及10°N~12°N、117°E附近, 分别对应图 10B (经纬度对CPUE影响效应的三维空间图)中的穹顶部及右侧的两处凸起。穹顶部区域(10°N~12°N, 112°E~114°E) CPUE最高, 且红色虚线(1个正的标准差)和蓝色虚线(1个负的标准差)表示此处标准差置信区间小于右侧凸起处, 其置信度较高。调查期间渔获量93.259 t, 平均CPUE 277.557 kg/网。穹顶部区域内渔获量20.972 t, CPUE 308.412 kg/网; 作业主要集中在4月、9月, 其中9月渔获量10.289 t, CPUE 381.083 kg/网; 4月渔获量9.234 t, CPUE 279.818 kg/网。9月CPUE明显高于4月。
|
图 10 GAM模型中变量对鸢乌贼CPUE的影响图 Fig.10 GAM-derived effects of six predictors on CPUE of Sthenoteuthis oualaniensis |
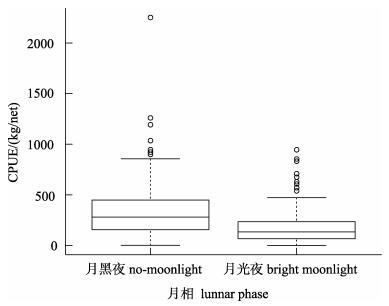
月相的方差解释率居于次位, 为16.8%。图 10D显示月相对鸢乌贼CPUE的影响曲线呈V型, 先降低后升高, 低谷出现在月光夜。月黑夜作业193网, 渔获量67.351 t, CPUE 348.970 kg/网; 月光夜作业143网, 渔获量25.908 t, CPUE 181.176 kg/网。单因素方差分析表明月黑夜与月光夜间的鸢乌贼CPUE存在显著性差异(P=1.08e–09 < 0.05)(图 3)。
|
图 3 月黑夜与月光夜鸢乌贼CPUE的箱型图 Fig.3 Box figure of Sthenoteuthis oualaniensis CPUE in no-moonlight and bright moonlight night |
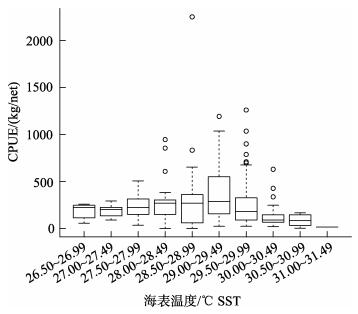
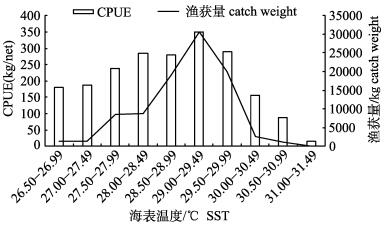
SST的方差解释率为14.8%, 居于第三位。28.00 ℃以下、30.00 ℃以上时置信区间大, 数据密度小, 置信度低; 28.00~30.00 ℃置信度较高, 影响曲线呈先降低, 小幅回升后再降低的趋势, 波峰位于29.50 ℃附近(图 10F)。单因素方差分析表明不同SST分组的鸢乌贼CPUE不存在显著性差异(P=0.872 > 0.05)(图 4)。28.50~29.99 ℃时鸢乌贼渔获量为69.619 t, 占总渔获量的74.65%, 且CPUE为309.419 kg/网, 为平均CPUE的1.11倍; 其中CPUE与渔获量最高的温度分组均为29.00~29.49 ℃(图 5), CPUE 348.724 kg/网, 渔获量30.688 t。
|
图 4 不同SST分组的鸢乌贼CPUE箱型图 Fig.4 Box figure of Sthenoteuthis oualaniensis CPUE under different SST groups |
|
图 5 不同SST分组的鸢乌贼平均CPUE与渔获量 Fig.5 The average CPUE and weight of Sthenoteuthis oualaniensis under different SST groups |
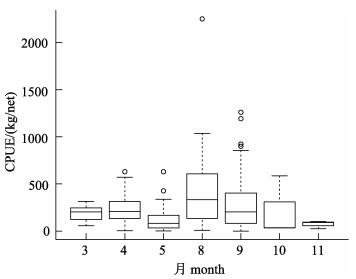
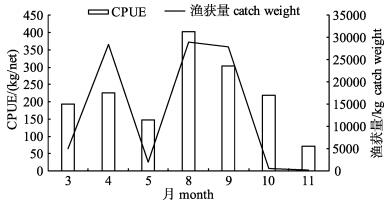
月份的方差解释率为3.8%。图 10C显示3—5月对CPUE的影响呈递增趋势, 8—11月呈递减趋势。单因素方差分析表明不同月份间的鸢乌贼CPUE存在显著性差异(P=0.000134 < 0.05)(图 6)。8月CPUE最高, 且8月、9月的CPUE高于3月、4月; 鸢乌贼渔获量主要集中在4月、8月、9月, 且数值差异不大, 分别为28.380 t、28.932 t、27.960 t (图 7)。
|
图 6 不同月份鸢乌贼CPUE的箱型图 Fig.6 Box figure of Sthenoteuthis oualaniensis CPUE in different months |
|
图 7 不同月份鸢乌贼的平均CPUE与渔获量 Fig.7 The average CPUE and weight of Sthenoteuthis oualaniensis in different months |
作业时间的方差贡献率为5.7%。图 10E显示作业时间对鸢乌贼CPUE的影响呈穹顶状, 先升高后降低, 波峰位于凌晨1时附近。单因素方差分析表明不同作业时间的鸢乌贼CPUE不存在显著性差异(P= 0.15 > 0.05)(图 8)。CPUE的最大值出现在凌晨1时(指1时到2时这一时段), 为410.932 kg/网, 渔获量最高的时间为21时, 但此时CPUE较低, 仅为180.043 kg/网(图 9), 20时CPUE高于21时, 但此时作业网次太少, 参考价值不大。
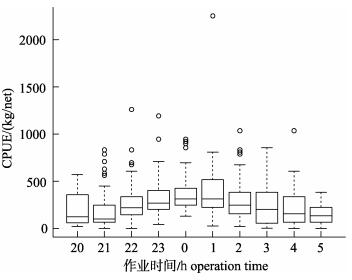
|
图 8 不同作业时间鸢乌贼CPUE的箱型图 Fig.8 Box figure of Sthenoteuthis oualaniensis CPUE in different operation time groups |
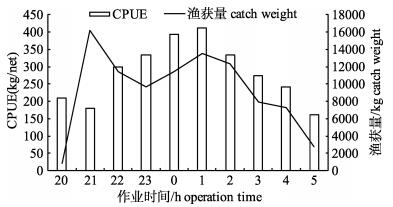
|
图 9 不同作业时间鸢乌贼的平均CPUE与渔获量 Fig.9 The average CPUE and weight of Sthenoteuthis oualaniensis in different operation time groups |
Δ50的方差贡献率为4.6%。图 10G显示Δ50对CPUE的影响曲线依次呈现一个波谷两个波峰, 而后下降的形状。单因素方差分析表明不同Δ50分组的CPUE不存在显著性差异(P=0.636 > 0.05) (图 11)。Δ50在0.100~0.149 ℃/m时CPUE最高, 为319.918 kg/网; 其次为‒0.049~‒0.001 ℃/m时, 为310.500 kg/网, 但此分组因作业网次少导致渔获量较小, 仅为9.004 t; 0.000~0.049 ℃/m时渔获量最大, 为47.890 t, 占总渔获量的51.35%, 但CPUE较低, 为258.865 kg/网(图 12)。
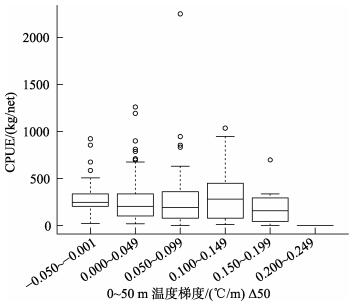
|
图 11 不同Δ50分组的鸢乌贼CPUE箱型图 Fig.11 Box figure of Sthenoteuthis oualaniensis CPUE under different Δ50 groups |
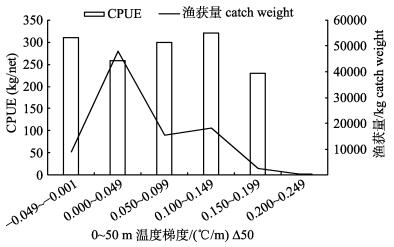
|
图 12 不同Δ50分组的鸢乌贼平均CPUE与渔获量 Fig.12 The average CPUE and weight of Sthenoteuthis oualaniensis under different Δ50 |
南沙海域北部靠近越南一侧的区域(10°N~12°N、112°E~114°E)鸢乌贼CPUE最高, 且9月CPUE明显高于4月。招春旭[24]分析2012—2014年南海海域作业渔船信息与生产数据发现南海鸢乌贼渔场重心在11°N、113°E海域, 与本研究结果相一致。该区域CPUE较高且9月明显高于4月的现象可能与越南东部沿海夏季存在的离岸流现象有关。离岸流有着明显的季节内和年际变化[25], 主轴位置集中在10°N~14°N, 平均约为12°N[26], 纬向范围在109°E~113°E之间[27], 离岸流伴随强烈的上升流动力过程, 二者共同导致SST降低, 叶绿素浓度和浮游植物密度变高[28]。离岸流现象对SST等海洋环境的影响很可能对鸢乌贼资源量的增长起到了积极作用。今后的研究中应重视离岸流区域的环境数据与渔获数据的采集, 进一步分析离岸流现象对鸢乌贼渔场形成的影响。
3.2 月相与SST月相对鸢乌贼CPUE影响显著。单因素方差分析表明月黑夜与月光夜间的鸢乌贼CPUE存在显著性差异, 月黑夜显著高于月光夜。这与晏磊等[17]、招春旭等[19]的研究结果相一致。月光夜因月光的影响, 灯光诱集鱼群的效果变差, 渔船在此期间一般试捕1、2网, 效益不佳便会停止作业。
SST是对鸢乌贼CPUE影响最大的环境因素。诸多研究[24, 29-32]证实SST是影响鱿鱼渔场(栖息地)分布的重要环境因素。头足类对海水温度较为敏感[33], 温度不仅影响头足类自身的生长(卵的孵化率[34]、成体大小和生命周期[35]), 还可能对饵料生物的丰度产生影响。本研究中鸢乌贼渔场的最适SST范围为29.00~29.49 ℃, 此范围内CPUE与渔获量均为最高; 28.50~29.99 ℃时也较适宜鸢乌贼的捕获。晏磊等[21]发现最适SST在春季和秋季基本一致, 范围为28.5~29.5 ℃, 与本研究结果较为一致; 徐红云等[29]认为南海外海鸢乌贼中心渔场的最适SST范围为26.4~29.6 ℃, 最适温度范围低于本研究。调查月份的不同可能是上述差异的原因, 南海SST在3月时较低, 4月开始升高, 本研究调查时间主要集中在4月、8月、9月, 3月调查网次较少, 仅占总网次的7.74%, 导致低SST的网次数据不足。
3.3 月份、作业时间与Δ50单因素方差分析表明不同月份间的鸢乌贼CPUE存在显著性差异, 8月CPUE最高, 且8月、9月的CPUE高于3月、4月。渔船捕捞鸢乌贼主要集中在春季, 8月份休渔期结束, 近海作业有利可图, 渔船倾向于近海作业, 无法捕获鸢乌贼资源[24]。针对这一现象, 或可鼓励罩网渔船在休渔期结束后前往外海作业, 这对缓解近海捕捞压力具有积极意义。
鸢乌贼CPUE随作业时间先变大后变小, 最大值出现在凌晨1时, 渔获量最高的时间为21时。21时是刚开始作业的时段, 存在较多试捕网次, 这可能是导致该段时间渔获量最高但CPUE较低的原因。鸢乌贼有明显的昼夜垂直迁移特性, 一般在傍晚开始上浮, 22:00左右上浮至100 m以浅水层, 4:00左右开始下沉[31]。这种迁移特性很可能是导致CPUE呈现上述规律的原因。
Δ50在0.100~0.149 ℃/m时CPUE最高; 0.000~0.049 ℃/m时渔获量最大, 但此时CPUE较低。晏磊等[21]认为5~50 m温度梯度对鸢乌贼渔获量影响显著, 春、秋季分别在0.00~0.05 ℃/m、0.15~0.20 ℃/m组距内CPUE较高, 与本研究结果存在差异。这种差异可能是调查区域、时间的不同导致的。温跃层会对鸢乌贼的昼夜垂直移动产生限制从而影响鸢乌贼的集群[24], 本研究中仪器测量深度不足, 今后应收集更深水层的温度数据, 完善温度梯度对鸢乌贼CPUE的影响分析。
| [1] |
Chen X J, Liu B L, Wang Y G. Cephalopods of the World[M]. Beijing: China Ocean Press, 2009: 312-442. [陈新军, 刘必林, 王尧耕. 世界头足类[M]. 北京: 海洋出版社, 2009: 312-442.]
|
| [2] |
Zhang J, Chen G B, Zhang P, et al. Estimation of purpleback flying squid (Sthenoteuthis oualaniensis) resource in the central and southern South China Sea based on fisheries acoustics and light-falling net[J]. Journal of Fishery Sciences of China, 2014, 21(4): 822-831. [张俊, 陈国宝, 张鹏, 等. 基于渔业声学和灯光罩网的南海中南部鸢乌贼资源评估[J]. 中国水产科学, 2014, 21(4): 822-831.] |
| [3] |
Zhang J, Qiu Y S, Chen Z Z, et al. Advances in pelagic fishery resources survey and assessment in open South China Sea[J]. South China Fisheries Science, 2018, 14(6): 118-127. [张俊, 邱永松, 陈作志, 等. 南海外海大洋性渔业资源调查评估进展[J]. 南方水产科学, 2018, 14(6): 118-127.] |
| [4] |
Li M, Zhang P, Zhang J, et al. Genetic differentiation of the purpleback flying squid, Sthenoteuthis oualaniensis, in the South China Sea:Population or species divergence[J]. Journal of Fishery Sciences of China, 2019, 26(1): 133-140. [李敏, 张鹏, 张俊, 等. 南海鸢乌贼的遗传差异:种群分化还是种间分化[J]. 中国水产科学, 2019, 26(1): 133-140.] |
| [5] |
Maury O, Gascuel D, Marsac F, et al. Hierarchical interpretation of nonlinear relationships linking yellowfin tuna (Thunnus albacares) distribution to the environment in the Atlantic Ocean[J]. Canadian Journal of Fisheries and Aquatic Sciences, 2001, 58(3): 458-469. DOI:10.1139/f00-261 |
| [6] |
Venables W N, Dichmont C M. GLMs, GAMs and GLMMs:An overview of theory for applications in fisheries research[J]. Fisheries Research, 2004, 70(2-3): 319-337. DOI:10.1016/j.fishres.2004.08.011 |
| [7] |
Zagaglia C R, Lorenzzetti J A, Stech J L. Remote sensing data and longline catches of yellowfin tuna (Thunnus albacares) in the equatorial Atlantic[J]. Remote Sensing of Environment, 2004, 93(1-2): 267-281. DOI:10.1016/j.rse.2004.07.015 |
| [8] |
Zainuddin M, Saitoh K, Saitoh S I. Albacore (Thunnus alalunga) fishing ground in relation to oceanographic conditions in the western North Pacific Ocean using remotely sensed satellite data[J]. Fisheries Oceanography, 2008, 17(2): 61-73. DOI:10.1111/j.1365-2419.2008.00461.x |
| [9] |
Zhu G P, Zhu X Y, Xu Y Y, et al. The spatiotemporal distribution of fishing grounds for Antarctic krill (Euphausia superba) around the South Orkney Islands in austral summer-autumn and its relation to environmental factors based on a generalized additive model[J]. Chinese Journal of Polar Research, 2012, 24(3): 266-273. [朱国平, 朱小艳, 徐怡瑛, 等. 基于GAM模型分析夏秋季南奥克尼群岛南极磷虾渔场时空分布及与环境因子之间的关系[J]. 极地研究, 2012, 24(3): 266-273.] |
| [10] |
Zhu G P. Effects of temporal and environmental factors on the fishing ground of Antarctic krill (Euphausia superba) in the northern Antarctic Peninsula based on generalized additive model[J]. Journal of Fisheries of China, 2012, 36(12): 1863-1871. [朱国平. 基于广义可加模型研究时间和环境因子对南极半岛北部南极磷虾渔场的影响[J]. 水产学报, 2012, 36(12): 1863-1871.] |
| [11] |
Tang H, Xu L X, Chen X J, et al. Effects of spatiotemporal and environmental factors on the fishing ground of skipjack tuna (Katsuwonus pelamis) in the Western and Central Pacific Ocean based on generalized additive model[J]. Marine Environmental Science, 2013, 32(4): 518-522. [唐浩, 许柳雄, 陈新军, 等. 基于GAM模型研究时空及环境因子对中西太平洋鲣鱼渔场的影响[J]. 海洋环境科学, 2013, 32(4): 518-522.] |
| [12] |
Chiu T Y, Chiu T S, Chen C S. Movement patterns determine the availability of Argentine shortfin squid Illex argentinus to fisheries[J]. Fisheries Research, 2017, 193: 71-80. DOI:10.1016/j.fishres.2017.03.023 |
| [13] |
Yang S L, Zhang B B, Tang B J, et al. Influence of vertical structure of the water temperature on bigeye tuna longline catch rates in the tropical Atlantic Ocean[J]. Journal of Fishery Sciences of China, 2017, 24(4): 875-883. [杨胜龙, 张忭忭, 唐宝军, 等. 基于GAM模型分析水温垂直结构对热带大西洋大眼金枪鱼渔获率的影响[J]. 中国水产科学, 2017, 24(4): 875-883.] |
| [14] |
Jia M X, Huang L Y, Chu J W, et al. Studies on the nonlinear and spatial nonstationary effects of environmental factors on the distribution of Antarctic krill (Euphausia superba)[J]. Periodical of Ocean University of China, 2019, 49(8): 19-26. [贾明秀, 黄六一, 褚建伟, 等. 基于GAM和GWR模型分析环境因子对南极磷虾资源分布的非线性和非静态性影响[J]. 中国海洋大学学报(自然科学版), 2019, 49(8): 19-26.] |
| [15] |
Yang S L, Fan X M, Wu Y M, et al. The relationship between the fishing ground of mackerel (Scomber australasicus) in Arabian Sea and the environment based on GAM model[J]. Chinese Journal of Ecology, 2019, 38(8): 2466-2470. [杨胜龙, 范秀梅, 伍玉梅, 等. 基于GAM模型的阿拉伯海鲐鱼渔场分布与环境关系[J]. 生态学杂志, 2019, 38(8): 2466-2470.] |
| [16] |
Li M K, Zhang C L, Li M, et al. Relationship between the spatiotemporal distribution of Conger myriaster and environmental factors in the southern waters off the Shandong Peninsula during autumn and winter[J]. Journal of Fishery Sciences of China, 2018, 25(5): 1115-1122. [李明坤, 张崇良, 李敏, 等. 山东南部近海秋、冬季星康吉鳗分布与环境因子的关系[J]. 中国水产科学, 2018, 25(5): 1115-1122.] |
| [17] |
Yan L, Zhang P, Yang L, et al. Effect of moon phase on fishing rate by light falling-net fishing vessels of Symplectoteuthis oualaniensis in the South China Sea[J]. South China Fisheries Science, 2015, 11(3): 16-21. [晏磊, 张鹏, 杨吝, 等. 月相对南海灯光罩网鸢乌贼渔获率的影响分析[J]. 南方水产科学, 2015, 11(3): 16-21. DOI:10.3969/j.issn.2095-0780.2015.03.003] |
| [18] |
Yan L, Li J, Yang B Z, et al. Relationship between sinking performance of light falling-net and catch rate of Sthenoteuthis oualaniensis[J]. South China Fisheries Science, 2018, 14(4): 10-16. [晏磊, 李杰, 杨炳忠, 等. 光诱罩网沉降性能对鸢乌贼渔获率的影响[J]. 南方水产科学, 2018, 14(4): 10-16. DOI:10.3969/j.issn.2095-0780.2018.04.002] |
| [19] |
Zhao C X, Qiu X Y, He X B, et al. Relationship between lunar phase, water depth and operation time and CPUE of purpleback flying squid (Sthenoteuthis oualaniensis) in South China Sea in spring[J]. Journal of Fisheries of China, 2019, 43(11): 2372-2382. [招春旭, 邱星宇, 何雄波, 等. 南海春季月相、水深、作业时间与鸢乌贼CPUE的关系[J]. 水产学报, 2019, 43(11): 2372-2382.] |
| [20] |
Fan J T, Zhang J, Feng X, et al. Relationship between Sthenoteuthis oualaniensis fishing ground and marine environmental factors in Nansha area[J]. Journal of Shanghai Ocean University, 2019, 28(3): 419-426. [范江涛, 张俊, 冯雪, 等. 南沙海域鸢乌贼渔场与海洋环境因子的关系[J]. 上海海洋大学学报, 2019, 28(3): 419-426.] |
| [21] |
Yan L, Zhang P, Yang B Z, et al. Relationship between the catch of Symplectoteuthis oualaniensis and surface temperature and the vertical temperature structure in the South China Sea[J]. Journal of Fishery Sciences of China, 2016, 23(2): 469-477. [晏磊, 张鹏, 杨炳忠, 等. 南海鸢乌贼产量与表温及水温垂直结构的关系[J]. 中国水产科学, 2016, 23(2): 469-477.] |
| [22] |
Briand K, Molony B, Lehodey P. A study on the variability of albacore (Thunnus alalunga) longline catch rates in the southwest Pacific Ocean[J]. Fisheries Oceanography, 2011, 20(6): 517-529. DOI:10.1111/j.1365-2419.2011.00599.x |
| [23] |
Song L M, Zhang Z. Effects of lunar phases and setting time on the catch rates of bigeye tuna and yellowfin tuna[J]. Journal of Dalian Ocean University, 2010, 25(3): 214-218. [宋利明, 张智. 月相和延绳钓不同投绳时间对大眼金枪鱼和黄鳍金枪鱼渔获率的影响[J]. 大连海洋大学学报, 2010, 25(3): 214-218. DOI:10.3969/j.issn.1000-9957.2010.03.005] |
| [24] |
Zhao C X. The Spatial-temporal distribution and the construction of the prediction model of the purpleback flying squid (Sthenoteuthis oualaniensis) in South China Sea[D]. Zhanjiang: Guangdong Ocean University, 2017: 1-47. [招春旭.南海鸢乌贼渔场时空分布及其预报模型构建[D].湛江: 广东海洋大学, 2017: 1-47.]
|
| [25] |
Li Y L, Han W Q, Wilkin J L, et al. Interannual variability of the surface summertime eastward jet in the South China Sea[J]. Journal of Geophysical Research:Oceans, 2014, 119(10): 7205-7228. DOI:10.1002/2014JC010206 |
| [26] |
Li H, Wang Q, Huang K, et al. Characteristics of eddy-mean flow interaction in the offshore current area of western South China Sea[J]. Oceanologia et Limnologia Sinica, 2017, 48(5): 912-925. [李晗, 王强, 黄科, 等. 1992-2011年夏季南海西部离岸流区涡流相互作用特征[J]. 海洋与湖沼, 2017, 48(5): 912-925.] |
| [27] |
Xiang R, Fang W D, Lu Y Z, et al. Observed three-dimensional structures of a cold eddy and an eastward jet in the western South China Sea during September 2014[J]. Journal of Tropical Oceanography, 2015, 34(6): 1-10. [向荣, 方文东, 鲁远征, 等. 2014年9月南海西部冷涡及东向急流三维结构观测[J]. 热带海洋学报, 2015, 34(6): 1-10.] |
| [28] |
Xie S P, Xie Q, Wang D X, et al. Summer upwelling in the South China Sea and its role in regional climate variations[J]. Journal of Geophysical Research:Oceans, 2003, 108(C8): 3261. DOI:10.1029/2003JC001867 |
| [29] |
Xu H Y, Cui X S, Zhou W F, et al. Analysis on optimal habitats of purpleback flying squid in the open South China Sea based on remote sensing data[J]. Chinese Journal of Ecology, 2016, 35(11): 3080-3085. [徐红云, 崔雪森, 周为峰, 等. 基于海洋遥感的南海外海鸢乌贼最适栖息环境分析[J]. 生态学杂志, 2016, 35(11): 3080-3085.] |
| [30] |
Tian S Q, Chen X J, Yang X M. Study on the fishing ground distribution of Symlectoteuthis oualaniensis and its relationship with the environmental factors in the high sea of the northern Arabian Sea[J]. Transactions of Oceanology and Limnology, 2006(1): 51-57. [田思泉, 陈新军, 杨晓明. 阿拉伯北部公海海域鸢乌贼渔场分布及其与海洋环境因子关系[J]. 海洋湖沼通报, 2006(1): 51-57. DOI:10.3969/j.issn.1003-6482.2006.01.007] |
| [31] |
Fan J T, Chen Z Z, Zhang J, et al. Sthenoteuthis oualaniensis fishing grounds analysis based on marine environmental factors and different weight coefficients in the Zhongxisha and Xisha Islands, South China Sea[J]. South China Fisheries Science, 2016, 12(4): 57-63. [范江涛, 陈作志, 张俊, 等. 基于海洋环境因子和不同权重系数的南海中沙西沙海域鸢乌贼渔场分析[J]. 南方水产科学, 2016, 12(4): 57-63. DOI:10.3969/j.issn.2095-0780.2016.04.007] |
| [32] |
Wen J, Lu X Y, Chen X J, et al. Predicting the habitat hot spots of winter-spring cohort of Ommastrephes bartramii in the northwest Pacific Ocean based on the sea surface temperature and photosynthetically active radiation[J]. Journal of Shanghai Ocean University, 2019, 28(3): 456-463. [温健, 陆鑫一, 陈新军, 等. 基于海表温度和光合有效辐射的西北太平洋柔鱼冬春生群体栖息地热点预测[J]. 上海海洋大学报, 2019, 28(3): 456-463.] |
| [33] |
Chen X J, Liu B L, Tian S Q, et al. Fishery biology of purpleback squid, Sthenoteuthis oualaniensis, in the northwest Indian Ocean[J]. Fisheries Research, 2007, 83(1): 98-104. |
| [34] |
Staaf D J, Zeidberg L D, Gilly W F. Effects of temperature on embryonic development of the Humboldt squid Dosidicus gigas[J]. Marine Ecology Progress Series, 2011, 441: 165-175. DOI:10.3354/meps09389 |
| [35] |
Arkhipkin A, Argüelles J, Shcherbich Z, et al. Ambient temperature influences adult size and life span in jumbo squid (Dosidicus gigas)[J]. Canadian Journal of Fisheries and Aquatic Sciences, 2015, 72(3): 400-409. DOI:10.1139/cjfas-2014-0386 |
 2020, Vol. 27

