2. 农业农村部水生动物基因组学重点实验室, 北京 100141;
3. 中国水产科学研究院生物技术研究中心, 北京 100141;
4. 中国水产科学研究院黑龙江水产研究所, 黑龙江 哈尔滨 150070
2. Key Laboratory of Aquatic Genomics, Ministry of Agriculture and Rural Affairs, Beijing 100141, China;
3. Aquatic Genomics and Beijing Key Laboratory of Fishery Biotechnology, Chinese Academy of Fishery Sciences, Beijing, 100141, China;
4. Heilongjiang River Fisheries Research Institute, Chinese Academy of Fishery Sciences, Harbin 150070, China
在现代水产养殖中, 抗病、生长、性别决定和性成熟是几个主要的育种方向。在诸多的生长性状中, 体重和形态特征, 可以在不同的尺度下(重量、长度和面积)进行评估。由于生长性状是在连续的时间以及空间点上表现出来的[1], 因此它们属于动态的数量性状[2]。这些性状也被称为无限维性状[3], 其在任何时间和空间点上评估的表型都被视为不同的性状。虹鳟(Oncorhynchus mykiss)作为引进种在中国广泛养殖。通常销售的都是较大尺寸的虹鳟, 并且绝大多数以生鱼片的形式售卖, 因此在收获时体重被视为最重要的经济性状。如果在虹鳟性成熟之前, 它的体重超过了1 kg, 就可以提前上市销售。虹鳟的收获期则有可能从1.5年龄持续到性成熟期(3年龄)。因此在虹鳟1.5年龄至3年龄这段时间, 要努力维持虹鳟的加速生长并确保其群体生长过程的均匀性。
目前, 国内的研究者对虹鳟生长性状的遗传分析有较多的研究。王炳谦等[4]应用重复力模型对5个虹鳟品系后代进行了生长性状的遗传力和育种值估计, 结果表明, 虹鳟体重、体长和肥满度的表型趋势和遗传趋势基本一致, 且3个性状都属于中等遗传力; 刘宗岳等[5]的研究中也得出虹鳟体重和体长均属于中等遗传力。实际上, 要对虹鳟的生长过程进行遗传分析, 需要在该过程中的特定阶段(在某几天、几周或几个月)对生长性状进行反复测量。在早期的研究中, 利用单变量动物模型分别分析了特定年龄段的生长性状[6-15]。同时, 多变量动物模型被用来估计一段时间内生长性状的遗传相关[8, 10, 14, 16-24]。这些分析很大程度上受到可变的和无规律的测定时间的限制[25]。
当对同一个体进行反复测量时, 可以为该个体绘制一条随时间变化的生长曲线。在20世纪90年代, 研究者推出了奶牛产奶日期的随机回归模型[3], 该模型也常用于评估水产养殖中生长曲线的遗传参数[15, 26-28]。随机回归模型可以灵活地计算任何年龄的生长性状遗传力以及一段时间内的遗传相关。特别是多变量随机回归模型, 还可以估计成对性状之间的遗传相关, 并且改进每个性状的遗传力估计值。与将不同年龄的表型视为同一性状进行分析的简单重复力模型相比, 随机回归模型有利于动态性状的遗传分析, 同时还可以提高育种值的预测准确度[3, 29]。
本研究选择中国渤海、丹麦、挪威、美国唐纳森和加州5个虹鳟种系的幼苗, 在中国进行选育。在虹鳟的养殖中, 体重(body weight, BW)是研究者最感兴趣的性状, 而体长(body length, BL)则作为辅助性状。在不同的生长时期, 会反复测量这两个性状。我们利用生长曲线来表征虹鳟的生长过程, 评估所有可能收获期内体重和体长的遗传参数, 并且比较遗传变异的变化。通过分析体重在成对日龄之间以及体重和体长(作为体重的一个指示性状)在任意日龄之间的遗传相关, 可以对这两个性状的早期选择进行遗传评估。
1 材料和方法 1.1 实验群体在2001年从日本和韩国、丹麦、挪威、美国分别引进渤海、丹麦、挪威、唐纳森和加利福尼亚5种虹鳟幼苗[30]。2005年至2017年, 在中国水产科学研究院黑龙江水产研究所冷水鱼实验站进行虹鳟杂交育种。首先通过亲鱼间双列杂交育种获得第一代, 随后采用因子交配系统对接下来的三代进行闭锁繁育, 由此得到本实验中的第四代实验个体。
每一代70个家系的鱼苗都分别在一个直径为1 m, 水深为0.8 m的贮水池中单独饲养。一年后, 选择35个家系, 从各家系中随机选择100尾鱼进行PIT标记, 将所有标记后的鱼混养在3个相邻的矩形水泥池里(5 m×30 m×0.7 m), 尽可能保证每个水池中鱼的数量相同。在循环水系统中, 所有的鱼都用北京BioMar公司的标准商业化饲料手动喂食过量。在自然光周期下, 水的温度波动范围在5℃至16℃。定期检测水中溶解氧水平, 使其保持在7.5 mg/L以上。
使用上海耀华公司的电子秤(13版XK3190- A12+Ek)称量注射过标记的鱼的体重, 并用卡尺测量其体长。在每次测量之前, 用0.5 ml/L苯氧乙醇将它们麻醉。在3年的生长期内, 共测量过5次第4代虹鳟的体重和体长, 在给虹鳟注射标记时进行了第一次测量。
去掉异常值和错误记录后, 共获得4368尾个体的19299条记录。其中, 拥有3次测量记录的有233个个体, 4次记录的有2075尾个体, 5次记录的有2060尾个体。表 1列出了5个不同时间点的两种生长性状表型值的平均值和标准差。收集了4499尾个体的系谱信息, 它们都源于67尾雄鱼和66尾雌鱼。
|
|
表 1 不同日龄虹鳟的体重和体长 Tab.1 Body weights and body lengths of Oncorhynchus mykiss at different days of age |
对于重复测量直到性成熟的表型数据而言, 测定日、性别和代次被考虑为固定效应, 家系效应、加性遗传效应和永久环境效应作为随机效应。不同阶次的勒让德多项式常用于表征性别和世代效应以及3个随机效应随着日龄的变化情况。根据Schaeffer [3]提出的随机回归模型, 我们构建了体重或体长的单性状随机回归模型如下:
| $ \begin{array}{l} y{(t)_{ijkhl}} = {\rm{T}}{{\rm{d}}_i} + \sum\limits_{m = 0}^{{q_0}} {{s_{jm}}{P_m}(t)} + \sum\limits_{m = 0}^{{q_0}} {{g_{km}}{P_m}(t)} + \\ \;\;\;\;\sum\limits_{m = 0}^{{q_1}} {{f_{hm}}{P_m}(t)} + \sum\limits_{m = 0}^{{q_0}} {{a_{im}}{P_m}(t)} + \\ \;\;\;\;\sum\limits_{m = 0}^{{q_3}} {{\rm{p}}{{\rm{e}}_{im}}{P_m}(t)} + e{(t)_{ijkhl}} \end{array} $ |
式中, y(t)ijkhl是指在第l个测定日, 第k代, 第h个家系, 第j个性别的第i个个体的体重或体长; Tdl是指第l个测定日的效应; sjm是指第j个性别的固定效应回归系数; gkm是指第k个代次的固定效应回归系数; fhm是指第h个家系的随机效应回归系数; aim是指系谱中每个特定个体的加性遗传效应的随机回归系数; peim是相应的永久环境效应的随机回归系数; e(t)ijkhl是指每个观测值的误差效应; q0、q1、q2和q3分别是勒让德多项式中性别、家系、加性遗传和永久环境效应的阶次。勒让德多项式的前5个协变量是
体重或体长的随机模型用矩阵形式可以表示如下:
| $ \mathit{\boldsymbol{y}} = \mathit{\boldsymbol{X}}b + \mathit{\boldsymbol{Wf}} + \mathit{\boldsymbol{Za}} + \mathit{\boldsymbol{Q}}{p_e} + e $ |
其中, y是包含n个个体重复观测值的矩阵; b表示包括测定日、性别和代次在内的所有固定效应的向量; f是家系效应随机回归系数的n×q1向量; a是系谱中加性遗传效应随机回归系数的n×q2向量; pe是永久环境效应随机回归系数的n×q3向量; e是误差效应的向量, X、W、Z和Q是相应的指示变量和协变量矩阵。
该模型满足
| $ y|b, f, a, {p_e}, R \sim N(\mathit{\boldsymbol{Xb}} + \mathit{\boldsymbol{Wf}} + \mathit{\boldsymbol{Za}} + \mathit{\boldsymbol{Q}}{p_e}, R) $ |
和
| $ {(fa{p_e})^{\rm{T}}} \sim N(0, V) $ |
式中
| $ \mathit{\boldsymbol{V}} = \left[ {\begin{array}{*{20}{c}} {\mathit{\boldsymbol{I}} \otimes \mathit{\boldsymbol{F}}}&0&0&0\\ 0&{\mathit{\boldsymbol{G}} \otimes \mathit{\boldsymbol{A}}}&0&0\\ 0&0&{\mathit{\boldsymbol{I}} \otimes \mathit{\boldsymbol{PE}}}&0\\ 0&0&0&\mathit{\boldsymbol{R}} \end{array}} \right] $ |
其中F是家系效应随机回归系数的q1阶协方差矩阵; G是加性遗传效应随机回归系数的q2阶协方差矩阵, 对所有个体赋值相同; A是系谱中个体之间的加性遗传相关矩阵; I是单位矩阵; PE是永久环境效应回归系数的q3阶协方差矩阵; R是一个对角矩阵, 对角线上的元素为误差方差, 不同时间间隔赋予不同的值, 可以表示为
|
|
表 2 不同时间间隔内虹鳟样本量大小及误差方差估计值 Tab.2 The sample sizes and estimates of residual error variances within age intervals |
为了估计两个生长性状之间的遗传相关, 采用双变量遗传分析对这两个性状的随机回归模型同时进行求解。体重和体长加性遗传效应和永久环境效应的随机回归系数的协方差矩阵, 以及误差方差可以通过WOMBAT软件包, 采用约束最大似然法求解随机回归模型来获得[31]。每个固定效应的起始值被设置为0, 每个随机效应协方差矩阵被设置为单位矩阵, 误差方差被设置为1。限制性最大似然法的收敛标准被设定为10–6。
基于估计的协方差矩阵, 通过协方差函数计算任一日龄的性状遗传力和不同日龄之间的遗传相关[32]。家系效应、加性遗传效应和永久环境效应的第i日龄和第j日龄之间的协方差可以分别被估计为
最优随机回归模型是根据贝叶斯信息准则选择的[33]:
| $ {\rm{BI}}{{\rm{C}}_k} = - 2\ln ({\rm{M}}{{\rm{L}}_k}) + {p_k}\log (n) $ |
其中, log(MLk)是模型k中最大似然值的对数; pk是模型k中对似然值有贡献的自由参数的数量。通常情况下, BIC值越小则模型越优。
zi是指第i日龄家系效应的勒让德多项式的协变量;
zj是指第j日龄家系效应的勒让德多项式的协变量;
wi是指第i日龄加性遗传效应的勒让德多项式的协变量;
wj是指第i日龄加性遗传效应的勒让德多项式的协变量;
si是指第i日龄永久环境效应的勒让德多项式的协变量;
sj是指第j日龄永久环境效应的勒让德多项式的协变量;
贝叶斯信息准则选择的BIC公式里log是以e为底,即ln。
2 结果与分析 2.1 多变量随机回归模型优化通过分别优化每个性状的单变量随机回归模型来确定体重和体长的最优多变量随机回归模型。根据种群的生长曲线, 采用三阶勒让德多项式拟合性别和代次这两个固定效应。随机回归模型的选择就是根据贝叶斯信息准则选择拟合家系、加性遗传和永久环境这3个随机效应的勒让德多项式的阶次。阶次的范围是0~3。随机回归模型可以被指定为LPm1m2m3; 例如, LP121表示该模型中家系效应、加性遗传效应和永久环境效应的勒让德多项式阶次分别为1, 2和1。对每个性状而言, 总共需要对64(43)个随机回归模型进行比较。然而, 考虑家系效应时, 随机回归模型收敛不佳, 因此在WOMBAT软件包中运行随机回归模型时, 只需要比较16(42)个竞争模型即可。
表 3呈现了体重和体长16个竞争随机回归模型的贝叶斯信息准则的计算值。在被比较的16个随机回归模型中, 体重和体长的最优随机回归模型均为LP33, 即加性遗传效应和永久环境效应的勒让德多项式阶次都是3。
|
|
表 3 基于贝叶斯信息准则的体重和体长随机回归模型的选择 Tab.3 Choice of RRM for BW and BL based on BIC criterions |
在5个不同的年龄段内估计了体重和体长的误差协方差。如表 2所示, 日龄间隔越高, 其估计值越大。表 4列出了体重和体长随机回归系数的方差/协方差(标准误差)。除了一些较高和较低阶次的随机回归系数之间的协方差外, 其余所有随机回归系数的协方差均差异显著。一般来说, 低阶随机回归系数的遗传方差估计值大于高阶随机回归系数的, 截距也是一样规律。加性遗传效应的大部分随机回归系数之间的遗传相关为正值, 那些负遗传相关主要集中在截距与三元回归系数之间或单项式与三元回归系数之间。尤其是对于体重而言, 遗传相关和永久环境效应相关的性质(正负性)几乎相同。此外, 两个生长性状之间的所有同阶随机回归系数的遗传协方差和永久环境协方差都是正的。除了体重的截距和体长的二次项以及体重的三次项和体长的截距之间的遗传相关外, 不同日龄体重的随机回归系数与体长的随机回归系数之间呈现正遗传相关。
|
|
表 4 虹鳟体重和体长的加性遗传效应和永久环境效应的方差/协方差的估计值(标准误差) Tab.4 The estimates (standard errors) of additive genetic (co) variances and permanent environmental (co) variances for body weight and body length |
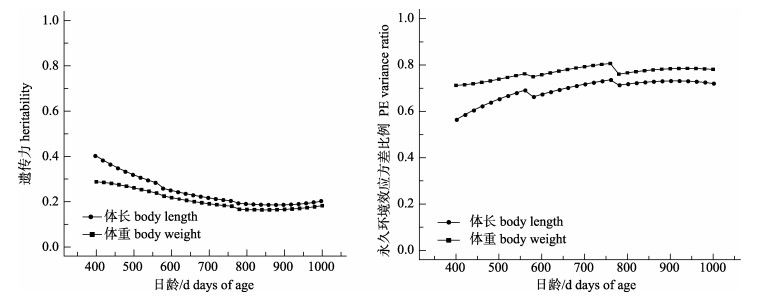
图 1展示了由双变量随机回归模型估计的遗传力和永久环境效应方差与表型方差的比例随日龄变化的规律。从400~1000日龄, 体重和体长的遗传力持续下降, 而且体长的遗传力相对于体重要高很多。在给定的日龄间隔内, 体重的遗传力变化非常平缓, 范围在0.164~0.288。在400日龄到1000日龄之间, 体长的遗传力由0.469变化到0.186, 775日龄之前呈现迅速下降的趋势, 此后保持相对稳定。永久环境效应方差与表型方差的比例变化形式与遗传力相反, 也就是说, 对体重而言初期上升随后趋于稳定, 而对体长而言初期上升而后略有下降。

|
图 1 虹鳟两个生长性状的遗传力和永久环境效应方差与表型方差的比例在不同日龄的变化 Fig.1 Changes in heritabilities and ratios of permanent environmental variances to phenotypic variances with days of age for the two growth traits of Oncorhynchus mykiss |
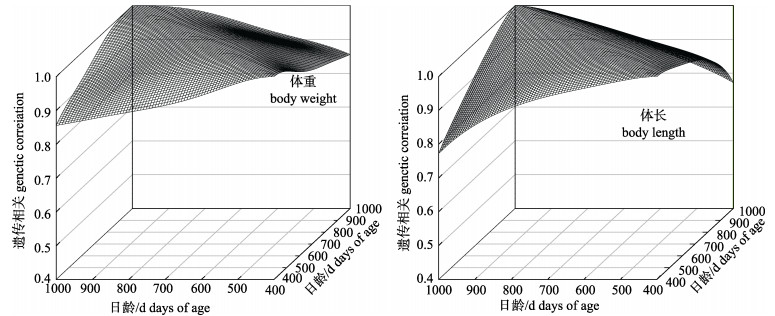
图 2显示了400~1000日龄间, 两个生长性状的成对日龄之间的遗传相关的三维图。体重和体长遗传相关的变化模式是相似的。连续日龄之间的遗传相关接近于1, 而间隔较大的两个日龄之间的遗传相关小于1, 并且随着日龄间隔的增加遗传相关持续降低。这两个性状在生长初期日龄之间的遗传相关比后期日龄之间的遗传相关高。在400~1000日龄, 体重的最小遗传相关为0.856, 体长的为0.772。在生长初期, 体重在成对日龄之间的遗传相关大于表型相关。表 5和表 6分别列出了体重和体长的成对生长日龄之间的表型相关和永久环境效应相关。在400~1000日龄, 体重的表型相关和遗传相关都超过了0.80, 体重的所有永久环境相关均超过0.90, 而体长的永久环境相关最小值为0.89。

|
图 2 虹鳟两个生长性状在两两日龄间的遗传相关 Fig.2 Genetic correlations of the two growth traits between pairwise days of age of Oncorhynchus mykiss |
|
|
表 5 虹鳟在两两日龄间, 体重的表型(下三角)相关和永久环境(上三角)相关 Tab.5 Phenotypic (lower triangle) and permanent environmental (upper triangle) correlations of body weight between pairwise days of age |
|
|
表 6 在两两日龄间, 体长的表型(下三角)相关和永久环境(上三角)相关 Tab.6 Phenotypic (lower triangle) and permanent environmental (upper triangle) correlations of body length between pairwise days of age of Oncorhynchus mykiss |
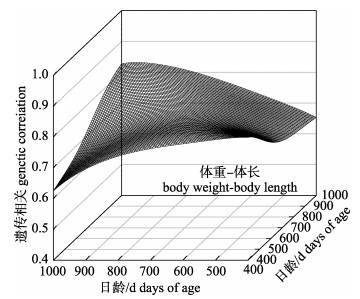
两个生长性状之间的遗传相关模式与单个性状在成对日龄之间的遗传相关模式相似; 然而图 3中两个性状之间在所选日龄的遗传相关三维图的脊比图 2中两个三维图的脊低, 因为单性状在同一日龄的遗传相关值为1。相同日龄之间, 体重和体长的遗传相关从800日龄的0.773变化至400日龄的0.828。反之, 在不同日龄之间, 遗传相关的最小值发生在体重的400日龄和体长的1000日龄之间。如表 7和表 8所示, 与遗传相关相比, 两个生长性状之间的永久环境效应相关和表型相关表现出与遗传相关相同的模式, 尽管同一日龄之间的相关系数大小不同。永久环境相关一致高于遗传相关和表型相关。在相同日龄之间, 两个性状的大部分表型相关一致高于遗传相关。
|
|
表 7 在所选虹鳟日龄时, 体长和体重之间的表型相关性 Tab.7 Phenotypic correlations between body weight and body length on the selected days of age of Oncorhynchus mykiss |
|
|
表 8 在所选虹鳟日龄时, 体长和体重之间的永久环境相关性 Tab.8 Permanent environmental correlations between body length and body weight on the selected days of age of Oncorhynchus mykiss |

|
图 3 虹鳟两个性状之间在所选日龄的遗传相关 Fig.3 Genetic correlations between the two growth traits on the selected days of age of Oncorhynchus mykiss |
与之前的罗非鱼多家系模型相比[15, 28], 本研究中构建的随机回归模型考虑了家系、加性遗传效应和永久环境效应对体重和体长的影响。勒让德多项式用于拟合这些随机效应随着年龄的变化。我们的模型选择不考虑家系对生长性状的影响, 这可能是由高强度的家系选择导致的。选择三阶勒让德多项式去拟合加性遗传效应和永久环境效应对体重和体长的影响, 表明多达六次的重复数据记录也没有获得较高的拟合度。巧合的是, 体重的最佳随机回归模型与McKay等[27]所构建的完全相同, 尽管他们并没有对模型进行选优。
本研究利用双变量随机回归模型, 估计出虹鳟体重的遗传力从0.16到0.29, 其在生长周期内变化稳定, 与McKay等[27]用单变量随机回归模型估计的虹鳟体重遗传力(0.08~0.49)相比, 我们估计的遗传力在最初和最后的生长天内相对较高, 但总体变化趋势相同, 都是在400日龄左右时遗传力最高, 随后呈下降趋势。多变量随机回归模型也被应用于罗非鱼生长性状的遗传评估研究中, He等[26]对尼罗罗非鱼体重、体长和体厚进行遗传分析研究, 三者遗传力的变化趋势为先上升后平缓, 与虹鳟有所区别。相同日龄的遗传力和遗传相关的估计值与之前在虹鳟上报道过的非常接近[34-42]。利用随机回归模型估计水产生物的生长性状的结果显示[3], 单个性状或者两个性状成对日龄之间的遗传相关随年龄间隔的增加而降低。然而, 成对日龄之间一致高的遗传相关使得我们可以在虹鳟的生长初期对体重性状进行选择。
当利用随机回归模型进行生长性状的遗传解析时, 生长过程中的重复数据测量是衡量随年龄变化的固定效应和随机效应所必需的。多次纵向的个体测量有助于更优地拟合生长曲线和更稳健地评估随机回归的遗传参数。然而, 过多的测量会增加试验成本并且影响鱼的生长, 尤其是当所有的实验个体同时测量时。在我们的研究中, 同时测量4368尾虹鳟个体花费了很高的劳动成本。未来的测试中, 大的实验群体将被分成几个独立的亚群体, 在多个生长点随机从每个亚群体抽取一定数量的实验个体进行测量。此外, 像这样多个家系的扩大测量将在多变量随机回归模型框架中帮助我们鉴定出虹鳟早期生长中的母体效应。
| [1] |
Yang Y Q, Li R J, Li S L. An estimation method for genetic parameters of dynamic traits[J]. Acta Veterinaria et Zootechnica Sinica, 1996, 27(5): 412-416. [杨运清, 李仁杰, 李淑玲. 动态性状遗传参数的估计方法[J]. 畜牧兽医学报, 1996, 27(5): 412-416. DOI:10.3321/j.issn:0366-6964.1996.05.005] |
| [2] |
Kirkpatrick M, Heckman N. A quantitative genetic model for growth, shape, reaction norms, and other infinite-dimensional characters[J]. Journal of Mathematical Biology, 1989, 27(4): 429-450. DOI:10.1007/BF00290638 |
| [3] |
Schaeffer L R. Application of random regression models in animal breeding[J]. Livestock Production Science, 2004, 86(1-3): 35-45. DOI:10.1016/S0301-6226(03)00151-9 |
| [4] |
Wang B Q, Liu Z Y, Gao H J, et al. Estimation of genetic parameters for growth traits in rainbow trout (Oncorhynchus mykiss) with different models[J]. Journal of Fisheries of China, 2009, 32(2): 182-187. [王炳谦, 刘宗岳, 高会江, 等. 应用重复力模型估计虹鳟生长性状的遗传力和育种值[J]. 水产学报, 2009, 32(2): 182-187.] |
| [5] |
Liu Z Y, Gao H J, Bai X J, et al. Estimation of genetic parameters for growth trait in rainbow trout with different model[J]. Chinese Journal of Fisheries, 2009, 22(1): 10-14. [刘宗岳, 高会江, 白秀娟, 等. 应用不同模型估计虹鳟生长性状的遗传参数[J]. 水产学杂志, 2009, 22(1): 10-14. DOI:10.3969/j.issn.1005-3832.2009.01.003] |
| [6] |
Bolivar R B, Newkirk G F. Response to within family selection for body weight in Nile tilapia (Oreochromis niloticus) using a single-trait animal model[J]. Aquaculture, 2002, 204(3-4): 371-381. DOI:10.1016/S0044-8486(01)00824-9 |
| [7] |
Charo-Karisa H, Komen H, Rezk M, et al. Heritability estimates and response to selection for growth of Niletilapia (Oreochromis niloticus) in low-input earthen ponds[J]. Aquaculture, 2006, 261(2): 479-486. DOI:10.1016/j.aquaculture.2006.07.007 |
| [8] |
Eknath A E, Bentsen H B, Ponzoni R W, et al. Genetic improvement of farmed tilapias:Composition and genetic parameters of a synthetic base population of Oreochromis niloticus for selective breeding[J]. Aquaculture, 2007, 273(1): 1-14. DOI:10.1016/j.aquaculture.2007.09.015 |
| [9] |
Gall G A E, Bakar Y. Application of mixed-model techniques to fish breed improvement:analysis of breeding-value selection to increase 98-day body weight in tilapia[J]. Aquaculture, 2002, 212(1-4): 93-113. DOI:10.1016/S0044-8486(02)00024-8 |
| [10] |
Maluwa A O, Gjerde B, Ponzoni R W. Genetic parameters and genotype by environment interaction for body weight of Oreochromis shiranus[J]. Aquaculture, 2006, 259(1-4): 47-55. DOI:10.1016/j.aquaculture.2006.06.033 |
| [11] |
Nguyen N H, Khaw H L, Ponzoni R W, et al. Can sexual dimorphism and body shape be altered in Nile tilapia (Oreochromis niloticus) by genetic means?[J]. Aquaculture, 2007, 272(Supplement 1): S38-S46. |
| [12] |
Ponzoni R W, Hamzah A, Tan S, et al. Genetic parameters and response to selection for live weight in the GIFT strain of Nile tilapia (Oreochromis niloticus)[J]. Aquaculture, 2005, 247(1-4): 203-210. DOI:10.1016/j.aquaculture.2005.02.020 |
| [13] |
Rutten M J M, Bovenhuis H, Komen H. Modeling fillet traits based on body measurements in three Nile tilapia strains (Oreochromis niloticus L.[J]. Aquaculture, 2004, 231(1): 113-122. |
| [14] |
Rutten M J M, Bovenhuis H, Komen H. Genetic parameters for fillet traits and body measurements in Nile tilapia (Oreochromis niloticus L.[J]. Aquaculture, 2005, 146(1-4): 125-132. |
| [15] |
Rutten M J M, Komen H, Bovenhuis H. Longitudinal genetic analysis of Nile tilapia (Oreochromis niloticus L.) body weight using a random regression model[J]. Aquaculture, 2005, 246(1-4): 101-113. DOI:10.1016/j.aquaculture.2004.12.020 |
| [16] |
Akar M, Baylan M, Sangün L. A quantitative genetic analysis of six phenotypes in Oreochromis niloticus in different olds[J]. Bi̇bad Biyoloji Bilimleri Araştırma Dergisi, 2013, 62-66. |
| [17] |
Bentsen H B, Gjerde B, Nguyen N H, et al. Genetic improvement of farmed tilapias:Genetic parameters for body weight at harvest in Nile tilapia (Oreochromis niloticus) during five generations of testing in multiple environments[J]. Aquaculture, 2012, 338-341: 56-65. DOI:10.1016/j.aquaculture.2012.01.027 |
| [18] |
Khaw H L, Ponzoni R W, Danting M J C. Estimation of genetic change in the GIFT strain of Nile tilapia (Oreochromis niloticus) by comparing contemporary progeny produced by males born in 1991 or in 2003[J]. Aquaculture, 2008, 275(1-4): 64-69. DOI:10.1016/j.aquaculture.2008.01.022 |
| [19] |
Khaw H L, Bovenhuis H, Ponzoni R W, et al. Genetic analysis of Nile tilapia (Oreochromis niloticus) selection line reared in two input environments[J]. Aquaculture, 2009, 294(1-2): 37-42. DOI:10.1016/j.aquaculture.2009.05.025 |
| [20] |
Luan T D, Olesen I, Kolstad K. Genetic parameters and genotype by environment interaction for growth of Nile tilapia in low and optimal temperature[C]//Proceedings of the 9th World Congress on Genetics Applied to Livestock Production, Leipzig, Germany, 2010.
|
| [21] |
Luan T D, Olesen I, deg rd J, et al. Genotype by environment interaction for harvest body weight and survival of Nile tilapia (Oreochromis niloticus) in brackish and fresh water ponds[C]//From the Pharaohs to the Future Eighth International Symposium on Tilapia in Aquaculture, 2008: 231-240.
|
| [22] |
Nguyen N H, Ponzoni R W, Abubakar K R, et al. Correlated response in fillet weight and yield to selection for increased harvest weight in genetically improved farmed tilapia (GIFT strain), Oreochromis niloticus[J]. Aquaculture, 2010, 305(1-4): 1-5. DOI:10.1016/j.aquaculture.2010.04.007 |
| [23] |
Rezk M A, Ponzoni R W, Khaw H L, et al. Selective breeding for increased body weight in a synthetic breed of Egyptian Nile tilapia, Oreochromis niloticus:Response to selection and genetic parameters[J]. Aquaculture, 2009, 293(3-4): 187-194. DOI:10.1016/j.aquaculture.2009.03.019 |
| [24] |
Thodesen J, Rye M, Wang Y X, et al. Genetic improvement of tilapias in China:Genetic parameters and selection responses in growth of Nile tilapia (Oreochromis niloticus) after six generations of multi-trait selection for growth and fillet yield[J]. Aquaculture, 2011, 322-323: 51-64. DOI:10.1016/j.aquaculture.2011.10.010 |
| [25] |
Valente B D, Silva M A, Silva L O C, et al. Covariance structure of body weight in function of age for Nellore animals from Southeast and Center West of Brazil[J]. Arquivo Brasileiro de Medicina Veterinária e Zootecnia, 2008, 60(2): 389-400. DOI:10.1590/S0102-09352008000200018 |
| [26] |
He J, Zhao Y F, Zhao J L, et al. Multivariate random regression analysis for body weight and main morphological traits in genetically improved farmed tilapia (Oreochromis niloticus)[J]. Genetics Selection Evolution, 2017, 49(1): 80. DOI:10.1186/s12711-017-0357-7 |
| [27] |
Mckay L R, Schaeffer L R, Mcmillan I. Analysis of growth curves in rainbow trout using random regression[C]//Proceedings of World Congress on Genetics Applied to Livestock Production Montpellier France August Session, 2002.
|
| [28] |
Turra E M, Valente B D, Teixeira E D A, et al. Estimation of genetic parameters for body weights of Nile tilapia Oreochromis niloticus using random regression models[J]. Aquaculture, 2012, 354-355(2): 31-37. |
| [29] |
Meyer K. Scope for a random regression model in genetic evaluation of beef cattle for growth[J]. Livestock Production Science, 2004, 86(1-3): 69-83. DOI:10.1016/S0301-6226(03)00142-8 |
| [30] |
Griffing B. Concept of general and specific combining ability in relation to diallel crossing systems[J]. Australian Journal of Biological Sciences, 1956, 9(4): 463-493. DOI:10.1071/BI9560463 |
| [31] |
Madsen P, Jensen J. A users guide to DMU, version 6, Release 5.0[M]. Arhusiensis, 2010.
|
| [32] |
Meyer K, Hill W G. Estimation of genetic and phenotypic covariance functions for longitudinal or 'repeated' records by restricted maximum likelihood[J]. Livestock Production Science, 1997, 47(3): 185-200. DOI:10.1016/S0301-6226(96)01414-5 |
| [33] |
Schwarz G. Estimating the dimension of a model[J]. Annals of Statistics, 1978, 6(2): 15-18. |
| [34] |
Brieuc M S, Purcell M K, Palmer A D, et al. Genetic variation underlying resistance to infectious hematopoietic necrosis virus in a steelhead trout (Oncorhynchus mykiss) population[J]. Diseases of Aquatic Organisms, 2015, 117(1): 77. DOI:10.3354/dao02933 |
| [35] |
Hu G, Wang F, Zhou J S, et al. Study on genetic diversity and germplasm sources of wild Yadong salmon population[J]. Journal of Northeast Agricultural University, 2016, 47(1): 58-65. [户国, 王芳, 周建设, 等. 野生亚东鲑群体遗传多样性及其种质来源研究[J]. 东北农业大学学报, 2016, 47(1): 58-65.] |
| [36] |
Hecht B C, Hard J J, Thrower F P, et al. Quantitative genetics of migration related traits in rainbow and steelhead trout[J]. Genes, Genomes, Genetics, 2015, 5(5): 873-889. |
| [37] |
Janhunen M, Kause A, Vehvilinen H, et al. Genetics of microenvironmental sensitivity of body weight in rainbow trout (Oncorhynchus mykiss) selected for improved growth[J]. PLoS ONE, 2012, 7(6): e38766. DOI:10.1371/journal.pone.0038766 |
| [38] |
Janhunen M, Kause A, Vehvil inen H, et al. Accounting for early rearing density effects on growth in the genetic evaluation of rainbow trout, Oncorhynchus mykiss[J]. Journal of Animal Science, 2013, 91(11): 5144-5152. DOI:10.2527/jas.2013-6683 |
| [39] |
Janhunen M, Koskela J, Ninh N H, et al. Thermal sensitivity of growth indicates heritable variation in 1-year-old rainbow trout (Oncorhynchus mykiss)[J]. Genetics Selection Evolution, 2016, 48(1): 94. DOI:10.1186/s12711-016-0272-3 |
| [40] |
Kause A, Kiessling A, Martin S A, et al. Genetic improvement of feed conversion ratio via indirect selection against lipid deposition in farmed rainbow trout (Oncorhynchus mykiss Walbaum)[J]. British Journal of Nutrition, 2016, 116(9): 1656-1665. DOI:10.1017/S0007114516003603 |
| [41] |
Sae-Lim P, Kause A, Janhunen M, et al. Genetic (co)variance of rainbow trout (Oncorhynchus mykiss) body weight and its uniformity across production environments[J]. Genetics Selection Evolution, 2015, 47(1): 46. DOI:10.1186/s12711-015-0122-8 |
| [42] |
Tibshirani R. Regression shrinkage and selection via the lasso:a retrospective[J]. Journal of the Royal Statistical Society, 2011, 73(3): 273-282. DOI:10.1111/rssb.2011.73.issue-3 |
 2018, Vol. 25

