 体长体重关系的时空差异
2. 山东省水生生物资源养护管理中心, 山东 烟台 264003;
3. 青岛海洋科学与技术国家实验室海洋渔业科学与食物产出过程功能实验室, 山东 青岛 266237

 (Lophius litulon)生活史特征的异质性,根据秋(2016年10月)、冬(2017年1月)、春(2017年5月)和夏(2017年8月)4个季节在山东近海的底拖网调查数据,对该物种体长-体重关系的时空差异进行了研究。本文构建了广义线性模型和9个线性混合效应模型,用来研究黄
 的体长-体重关系(W=aLb)及其时空差异。b的固定值(2.77)小于3,表示黄
 为负异速生长,肥满度与体长负相关,身体趋于细长。根据AIC值最小原则,最复杂的线性混合效应模型(即水域和季节对两个参数a和b均存在随机效应)拟合效果最佳;交叉验证的结果同样表明,该模型的预测效果最为可靠。根据最佳模型和广义线性模型的差异性分析结果,黄
 体长-体重关系的时空差异是极显著的(P < 0.01)。在最佳模型中,a值在春季最大,其次是秋季和冬季,而夏季最小;b值则与此相反。整体来看,纬度高的黄
 个体a值较大,b值较小,而a、b值与水深没有表现出明显规律。本研究表明,季节和纬度对黄
 的体长-体重关系具有显著的影响,混合效应模型能把水域和季节的异质性通过随机效应在单个模型中更准确、方便地体现出来,从而进一步证实了此模型在数据来源异质性研究中的优势。
 体长-体重关系 线性混合效应模型 时空差异
 2. Shandong Hydrobios Resources Conservation and Management Center, Yantai 264003, China;
3. Laboratory for Marine Fisheries Science and Food Production Processes; Qingdao National Laboratory for Marine Science and Technology, Qingdao 266237, China
体长-体重关系(length-weight relationship, LWR)是鱼类生活史研究的基础内容, 能够通过体长计算体重,进而求得种群生物量, 可以反映鱼类的生长模式(等速还是异速生长, 条件因子如何), 也可以间接反映鱼类栖息环境的质量[1]。因此体长-体重关系的研究是鱼类资源评估模型中不可或缺的部分, 对资源评估和管理具有重要意义[2-3]。
大量研究显示, 鱼类的体长-体重关系会受到季节、地理和环境条件等因子的影响, 因而导致其关系式中的参数值存在不同的异质性。例如, Moutopoulos等[4]发现爱琴海中九带
在不同的异质性研究方面, 线性混合效应模型(linear mixed-effects model, LMEM)是一种应用极其广泛的统计学模型。其线性预测不仅包含固定效应, 也包含随时间和地点等因子变化产生的随机效应, 因此能够分析多样化的数据[7], 而且已经广泛应用在很多领域中。Baayen等[8]介绍了混合效应模型能估计各种相关因子产生的随机效应; Xu等[7]用线性混合效应模型研究福建省杉木(Cunninghamia lanceolata)的冠幅, 得出了一个包含由地点引起的随机效应的模型; Ma等[1]在中国北部沿海小黄鱼体长-体重关系的研究中使用了线性混合效应模型, 在模型中考虑了不同年份和海域下的随机效应。
黄


黄


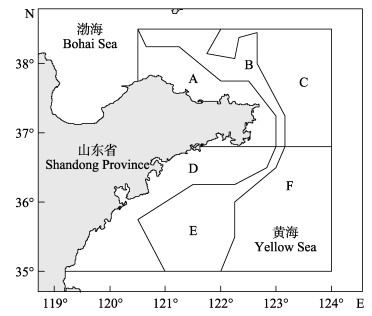
|
图 1 山东近海黄  |
|
|
表 1 山东近海黄  |
黄

| $ W = a{L^b}^{[14]} $ |
式中, W为体重(g), L为体长(cm), a是条件因子。b是生长参数, 若b < 3, 则表示随着体长的增加, 鱼的肥满度下降, 身体趋于细长; 若b=3, 则为等速生长; 若b > 3, 则表示随着体长的增加, 鱼的肥满度升高, 体高和体宽也增大[15]。
本文使用广义线性模型(generalized linear model, GLM)和9个LMEM模型来描述体长-体重关系(表 2), 其中这9个LMEM模型在参数a或b是否包含水域或季节产生的随机效应上各不相同。LMEM模型将水域和季节的影响作为参数a和b的随机效应, 以阐明体长和体重关系的时空差异[7]。使用F检验评估时空因子对黄

|
|
表 2 山东近海黄  |
利用赤池信息量准则(Akaike Information criterion, AIC)比较10个模型的拟合程度, 其值越小, 则表示模型的拟合效果越好[17]。为了评估模型的预测性能, 本研究应用交叉验证, 随机抽取80%的数据构建模型, 然后用建立的模型为剩余20%的数据进行预测, 将预测值和真实值进行对比检验, 重复100次, 最后得出该模型预测性能的评估结果[18]。用均方根误差RMSE (root mean square error)和决定系数(R2)判断最适合的模型。均方根误差越接近于0, 决定系数越接近于1, 则表示模型的预测值与样品的真实值越吻合, 即预测性能越好。
2 结果与分析 2.1 黄
山东近海此次调查所得黄


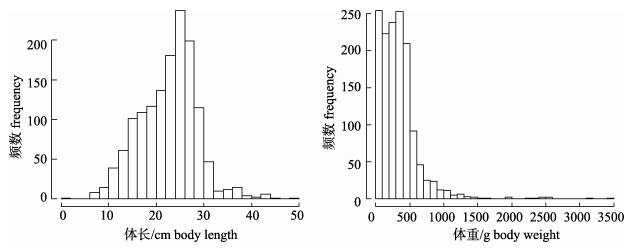
|
图 2 山东近海黄  |
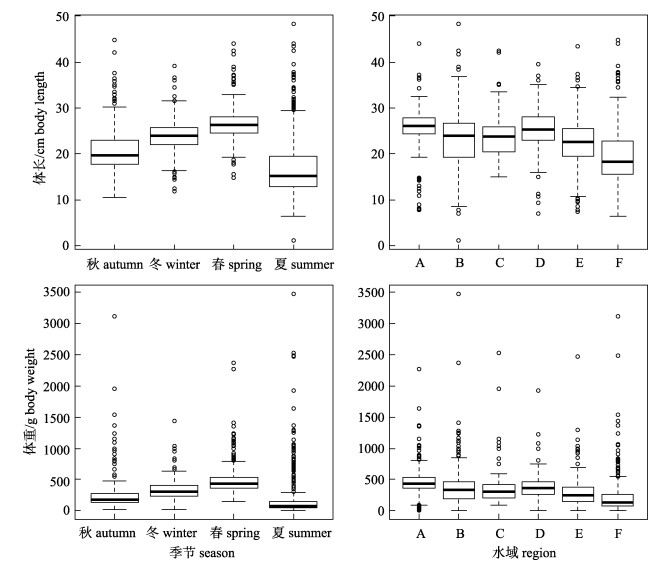
|
图 3 山东近海黄  |
在10个模型中, LMEM(R & T.I & S)的AIC值最小(表 2), 为439, 即同时具有水域和季节对两个参数的随机效应的线性混合效应模型对黄

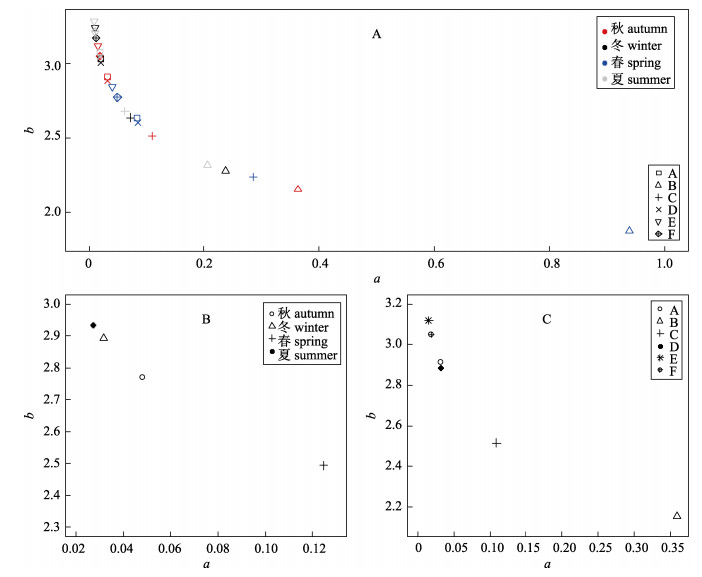
|
图 4 LMEM(R & T.I & S)中a和b的季节和水域差异
LMEM(R & T.I & S)为同时具有季节和水域对参数a和b的随机效应的线性混合效应模型. A:具有季节和水域随机效应的a值和b值; B: a和b的时间变化; C: a和b的空间变化. Fig.4 Variations of a and b among seasons and regions from the LMEM(R & T.I & S) LMEM (R & T.I & S) is a linear mixed-effects model with random effects on parameter a and b from seasons and regions. A: estimates of parameter a and b with random effects from seasons and regions; B: temporal variations of a and b; C: spatial variations of a and b. |
LMEM(R & T.I & S)模型的结果显示, 黄


在体长0~30 cm的黄


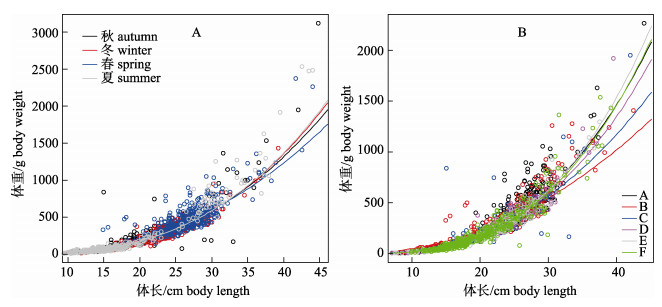
|
图 5 山东近海黄  |

根据LMEM(R & T.I & S)的结果, 由4个季节和6个水域得出的24个a的估计值(0.0089~0.9384)中, 有13个a值的范围为0.0089~0.0404, 在大多数鱼类的共同范围(0.001~0.05)之内[3], 也在Fishbase[19]中黄


Fishbase[20]中黄


在本研究中, a值在总体上表现出北部大于南部。在水深方面, a、b值没有呈现出明显的规律, 这可能是C和D区样品的数量较少和体长范围较小造成的。本研究共有1416个样品, 体长范围为1.1~48.3 cm, 而C和D区分别只有112和137个样品, 体长范围分别为15.0~42.5 cm和7.0~ 39.5 cm。Froese[3]的研究显示, 小的样品范围和少的数据会导致体长-体重关系参数值的结果变化性较大。因此, C和D区可能出现了异常的结果, 对整体结果的分析产生了干扰。
3.2 线性混合效应模型在LWR时空差异研究中的应用根据AIC值比较和交叉验证的结果可知, 任何一个混合效应模型的拟合效果和预测能力, 均优于简单的广义线性模型。而包含对参数a和b的水域和季节随机效应的LMEM(R & T.I & S)模型拟合效果最好, 所以用于研究黄

由不同的数据来源建立不同的模型, 然后对这些模型的参数估计值进行比较, 这是异质性研究的传统方法。例如, Liu等[29]为了探求海州湾小黄鱼的体长-体重关系随时间的变化, 根据在5月、7月、9月和12月采集的数据, 构建了4个LWR模型; 管卫兵等[30]由2006—2008年的调查数据构建了各年的LWR模型, 以研究长江口水域刀鲚(Coilia nasus)溯河群体体长-体重关系的年际变化; 牛玉娟等[31]根据伊犁河三条支流采集的数据, 分别构建了一个LWR模型, 研究了各支流中新疆裸重唇鱼(Gymnodiptychus dybowskii)的体长-体重关系。这些单独构建起来的模型得出的参数估计值, 需要根据差异性检验进一步比较, 而随机效应的使用可以非常有效、合理地进行异质性研究。最常用的随机效应应用方法是混合效应模型, 在反映生物学时空差异的研究中更为普遍, 是一种将固定效应和随机效应结合起来的特殊统计模型[32-35]。在该模型中, 固定效应能反映所有样品的总体特点, 而随机效应则因样品不同的来源, 呈现出拟合参数值与参数平均值(即固定效应)的差异[36-38]。随机效应的估计值能反映多种数据来源下体长-体重关系的参数分布, 也可以避免统计分析中的过度参数化问题[34, 39-40]。
混合效应模型可以将所有数据来源产生的效应包含进一个模型之中。许多研究使用某一特定水域或时间的LWR来表现鱼类体长-体重关系的时空差异[41-43], 而混合效应模型能把水域和时间的随机效应在单个模型中体现出来, 从而能更快捷、有效地估计LWR的时空差异, 进一步证实了此模型在数据来源异质性研究中的优势。由于本研究只考虑了季节和水域的随机效应, 存在一定的不足, 所以在未来的研究中, 应该充分考虑性别、年份、环境因子和生长阶段等因素产生对黄


| [1] |
Ma Q Y, Jiao Y, Ren Y P. Linear mixed-effects models to describe length-weight relationships for yellow croaker (Larimichthys polyactis) along the north coast of China[J]. PLoS ONE, 2017, 12(2): 1-17. |
| [2] |
Pauly D. Fishbyte section editorial[J]. Naga:the International Center for Living Aquatic Resources Management Quarterly, 1993, 16(2-3): 26. |
| [3] |
Froese R. Cube law, condition factor and weight-length relationships:History, meta-analysis and[U1] recommendations[J]. Journal of Applied Ichthyology, 2006, 22(4): 241-253. DOI:10.1111/jai.2006.22.issue-4 |
| [4] |
Moutopoulos D K, Stergiou K I. Length-weight and length-length relationships of fish species of the Aegean Sea (Greece)[J]. Journal of Applied Ichthyology, 2009, 18(3): 200-203. |
| [5] |
Li Z L, Jin X S, Shan X J, et al. Inter-annual changes on body weight-length relationship and relative fatness of small yellow croaker (Larimichthys polyactis)[J]. Journal of Fishery Sciences of China, 2011, 18(3): 602-610. [李忠炉, 金显仕, 单秀娟, 等. 小黄鱼体长-体质量关系和肥满度的年际变化[J]. 中国水产科学, 2011, 18(3): 602-610.] |
| [6] |
Lin B, Xu Q. A study on the weight-length relationship of fish from Daya Bay[J]. Tropic Oceanology, 1989, 8(4): 93-99. [林斌, 徐青. 大亚湾鱼类体重和体长的相关关系[J]. 热带海洋, 1989, 8(4): 93-99.] |
| [7] |
Xu H, Sun Y J, Wang X J, et al. Linear mixed-effects models to describe individual tree crown width for China-fir in Fujian province, southeast China[J]. PLoS ONE, 2015, 10(4): e0122257. DOI:10.1371/journal.pone.0122257 |
| [8] |
Baayen R H, Davidson D J, Bates D M. Mixed-effects modeling with crossed random effects for subjects and items[J]. Journal of Memory & Language, 2008, 59(4): 390-412. |
| [9] |
Cheng J H, Zhang X J. Review of biology and fishery of major anglerfish[J]. Journal of Fishery Sciences of China, 2010, 17(1): 161-167. [程家骅, 张学健.   属鱼类的渔业生物学与渔业的研究概况[J]. 中国水产科学, 2010, 17(1): 161-167.] 属鱼类的渔业生物学与渔业的研究概况[J]. 中国水产科学, 2010, 17(1): 161-167.] |
| [10] |
Zhang X J, Shen W, Li J S, et al. Distribution pattern of Lophius litulon and its relationship with environmental factors in the south Yellow Sea and north East China Sea[J]. Marine Fisheries, 2010, 32(1): 59-65. [张学健, 沈伟, 李建生, 等. 黄海南部和东海中北部黄   数量分布及其与环境的关系[J]. 海洋渔业, 2010, 32(1): 59-65. DOI:10.3969/j.issn.1004-2490.2010.01.009] 数量分布及其与环境的关系[J]. 海洋渔业, 2010, 32(1): 59-65. DOI:10.3969/j.issn.1004-2490.2010.01.009] |
| [11] |
Li Z L, Shan X J, Jin X S, et al. Interannual variations in the biological characteristics, distribution and stock density of anglerfish Lophius litulon in the central and southern Yellow Sea[J]. Acta Ecologica Sinica, 2015, 35(12): 4007-4015. [李忠炉, 单秀娟, 金显仕, 等. 黄海中南部黄   生物学特征及其资源密度的年际变化[J]. 生态学报, 2015, 35(12): 4007-4015.] 生物学特征及其资源密度的年际变化[J]. 生态学报, 2015, 35(12): 4007-4015.] |
| [12] |
Lin L S, Zheng Y J. Preliminary research on stock of Lophius litulon in the East China Sea region[J]. Marine Fisheries, 2004, 26(3): 179-183. [林龙山, 郑元甲.   资源状况的初步探讨[J]. 海洋渔业, 2004, 26(3): 179-183. DOI:10.3969/j.issn.1004-2490.2004.03.004] 资源状况的初步探讨[J]. 海洋渔业, 2004, 26(3): 179-183. DOI:10.3969/j.issn.1004-2490.2004.03.004] |
| [13] |
Xu K D, He Z T, Li P F, et al. Age and growth of Lophius litulon in north of the East China Sea and south of the Yellow Sea[J]. Progress in Fishery Sciences, 2010, 31(6): 9-14. [徐开达, 贺舟挺, 李鹏飞, 等. 东海北部、黄海南部黄   的年龄和生长[J]. 渔业科学进展, 2010, 31(6): 9-14. DOI:10.3969/j.issn.1000-7075.2010.06.002] 的年龄和生长[J]. 渔业科学进展, 2010, 31(6): 9-14. DOI:10.3969/j.issn.1000-7075.2010.06.002] |
| [14] |
Keys A B. The weight-length relationship in fishes[J]. Proceedings of the National Academy of Sciences of the United States of America, 1928, 14(12): 922-925. DOI:10.1073/pnas.14.12.922 |
| [15] |
Froese R. Cube law, condition factor and weight-length relationships:History, meta-analysis and recommendations[J]. Journal of Applied Ichthyology, 2006, 22(4): 241-253. DOI:10.1111/jai.2006.22.issue-4 |
| [16] |
Bates D, Machler M, Bolker B M, et al. Fitting linear mixed-effects models using lme4[J]. Journal of Statistical Software, 2015, 67(1): 1-48. |
| [17] |
Burnham K P, Anderson D R. Model Selection and Multimodel Inference:A Practical Information Theoretic Approach[M]. Second Edition. New York: Springer Press, 2002: 484-488.
|
| [18] |
Tanaka K, Chen Y. Spatiotemporal variability of suitable habitat for American lobster (Homarus americanus) in Long Island Sound[J]. Journal of Shellfish Research, 2015, 34(2): 531-543. DOI:10.2983/035.034.0238 |
| [19] |
Froese R, Thorson J T, Reyes R B. A Bayesian approach for estimating length-weight relationships in fishes[J]. Journal of Applied Ichthyology, 2014, 30(1): 78-85. DOI:10.1111/jai.2014.30.issue-1 |
| [20] |
Tesch F W. Methods for Assessment of Fish Production in Fresh Waters[M]. Oxford: Blackwell Scientific Press, 1968: 93-123.
|
| [21] |
Chen D G. Fisheries Ecology of Yellow Sea and Bohai Sea[M]. Beijing: China Ocean Press, 1991: 478-480. [陈大刚. 黄渤海渔业生态学[M]. 北京: 海洋出版社, 1991: 478-480.]
|
| [22] |
Yoneda M, Tokimura M, Fujita H, et al. Age and growth of Anglerfish Lophius litulon in the East China Sea and the Yellow Sea[J]. Fisheries Science, 1997, 63(6): 887-892. DOI:10.2331/fishsci.63.887 |
| [23] |
Zhang X J, Cheng J H, Shen W, et al. Reproductive biology of yellow goosefish Lophius litulon[J]. Journal of Fishery Sciences of China, 2011, 1802(2): 290-298. [张学健, 程家骅, 沈伟, 等. 黄   繁殖生物学研究[J]. 中国水产科学, 2011, 1802: 290-298.] 繁殖生物学研究[J]. 中国水产科学, 2011, 1802: 290-298.] |
| [24] |
Carlander K D. Handbook of Freshwater Fishery Biology[M]. Iowa: The Iowa State University Press, 1977: 421-431.
|
| [25] |
Petrakis G, Stergiou K I. Weight-length relationships for 33 fish species in Greek waters[J]. Fisheries Research, 1995, 21(3-4): 465-469. DOI:10.1016/0165-7836(94)00294-7 |
| [26] |
Bolognini L, Domenichetti F, Grati F, et al. Weight-length Relationships for 20 Fish Species in the Adriatic Sea[J]. Turkish Journal of Fisheries & Aquatic Sciences, 13(3): 563-568. |
| [27] |
Fatih C M, Bausta N, Cekic M. Weight-length relationships for selected fish species of the small-scale demersal fisheries off the south coast of İskenderun Bay[J]. Turkish Journal of Veterinary and Animal Sciences, 2002, 26(5): 1181-1183. |
| [28] |
Wilson J R, Kay M C, Colgate J, et al. Small-scale spatial variation in population dynamics and fishermen response in a coastal marine fishery[J]. PLoS ONE, 2012, 7(12): e52837. DOI:10.1371/journal.pone.0052837 |
| [29] |
Liu Q, Xu B, Ye Z, et al. Growth and mortality of small yellow croaker (Larimichthys polyactis) inhabiting Haizhou bay of China[J]. Journal of Ocean University of China, 2012, 11(4): 557-561. DOI:10.1007/s11802-012-2099-z |
| [30] |
Guan W B, Chen H H, Ding H T, et al. Reproductive characteristics and conditions of anadromous Coilia ectenes (Engraulidae) in Yangtze Estuary[J]. Marine Fisheries, 2010, 32(1): 73-81. [管卫兵, 陈辉辉, 丁华腾, 等. 长江口刀鲚洄游群体生殖特征和条件状况研究[J]. 海洋渔业, 2010, 32(1): 73-81. DOI:10.3969/j.issn.1004-2490.2010.01.011] |
| [31] |
Niu Y J, Ren D Q, Chen S A, et al. Growth characteristics of Gymnodiptychus dybowskii in three tributaries of the Ili River in Xinjiang, China[J]. Journal of Hydroecology, 2015, 36(6): 59-65. [牛玉娟, 任道全, 陈生熬, 等. 伊犁河三支流新疆裸重唇鱼的生长特性研究[J]. 水生态学杂志, 2015, 36(6): 59-65.] |
| [32] |
Helser T E, Lai H L. A Bayesian hierarchical meta-analysis of fish growth:with an example for North American largemouth bass, Micropterus salmoides[J]. Ecological Modelling, 2004, 178(3): 399-416. |
| [33] |
Gelman A, Hill J. Data Analysis Using Regression and Multilevel/Mierarchical Models[M]. New York: Cambridge University Press, 2006: 93-98.
|
| [34] |
Jiao Y, Rogers-Bennett L, Taniguchi I, et al. Incorporating temporal variation in the growth of red abalone (Haliotis rufescens) using hierarchical Bayesian growth models[J]. Canadian Journal of Fisheries & Aquatic Science, 2010, 67(4): 730-742. |
| [35] |
Thorson J T, Minto C. Mixed effects:a unifying framework for statistical modelling in fisheries biology[J]. ICES Journal of Marine Science, 2015, 72(5): 1245-1256. DOI:10.1093/icesjms/fsu213 |
| [36] |
Cnaan A, Laird N M, Peter S. Using the general linear mixed model to analyse unbalanced repeated measures and longitudinal data[J]. Statistics in Medicine, 1997, 16(20): 2349-2380. DOI:10.1002/(ISSN)1097-0258 |
| [37] |
Bernal-Rusiel J L, Greve D N, Reuter M, et al. Statistical analysis of longitudinal neuroimage data with linear mixed effects models[J]. Neuroimage, 2013, 66(2): 249-260. |
| [38] |
Thorson J T, Minte-Vera C V. Relative magnitude of cohort, age, and year effects on size at age of exploited marine fishes[J]. Fisheries Research, 2016, 180: 45-53. DOI:10.1016/j.fishres.2014.11.016 |
| [39] |
Schinckel A P, Adeola O, Einstein M E. Evaluation of alternative nonlinear mixed effects models of duck growth[J]. Professional Animal Scientist, 2005, 84(2): 256-264. |
| [40] |
Aggrey S E. Logistic nonlinear mixed effects model for estimating growth parameters[J]. Poultry Science, 2009, 88(2): 276-280. |
| [41] |
Ak O, Kutlu S, Aydin I. Length-weight relationship for 16 fish species from the Eastern Black Sea, Turkiye[J]. Turkish Journal of Fisheries & Aquatic Sciences, 2009, 9(1): 125-126. |
| [42] |
Wang X H, Xue Y, Ren Y P. Length-weight relationships of 43 fish species from Haizhou Bay, central Yellow Sea[J]. Journal of Applied Ichthyology, 2013, 29(5): 1183-1187. DOI:10.1111/jai.2013.29.issue-5 |
| [43] |
Xue Y, Ren Y P, Xu B D, et al. Length-weight relationships of fish species caught by bottom trawl in Jiaozhou Bay, China[J]. Journal of Applied Ichthyology, 2011, 27(3): 949-954. DOI:10.1111/jai.2011.27.issue-3 |
 2018, Vol. 25

