2. 青岛海洋科学与技术国家实验室, 海洋渔业科学与食物产出过程功能实验室, 山东 青岛 266072;
3. 浙江海洋大学水产学院, 浙江 舟山 316022
2. Qingdao National Laboratory for Marine Science and Technology, Function Laboratory for Marine Fisheries Science and Food Production Processes, Qingdao 266072, China;
3. School of Fishery, Zhejiang Ocean University, Zhoushan 316022, China
金乌贼(Sepia esculenta Hoyle, 1885)俗称乌鱼、墨鱼、乌子等, 是乌贼科中的重要经济种, 也是中国北方海域经济价值最大的乌贼[1]。其亲体每年春季由东、黄海越冬场集群游向近岸各产卵场繁殖产卵, 青岛近海金乌贼的产卵结群期为5月中旬至7月中上旬, 历时达2个月之久[2]。在结群期内, 随时间的推移, 陆续洄游至近岸的亲体规格呈逐渐减小趋势, 结群初期亲体的平均体重可达末期亲体平均体重的2~3倍[3]。据相关报道, 在东、黄海越冬的金乌贼可分为3个群体, 虽有各自的产卵场, 但部分群体产卵洄游时会交叉汇合[4]。
形态学研究方法和分子标记技术被广泛应用于物种的分类鉴别。其中, 形态学度量又被称为生物学测定方法, 其通过对不同群体量度特征的大量统计和分析, 阐明其形态性状的连续和变异并判明差异, 主成分分析和判别分析等多元分析方法能够简单直观地表现不同群体间的形态差异, 可以清晰表明群体结构的分化模式[5-9]。微卫星DNA是广泛分布于真核生物基因组中的简单重复序列(simple sequence repeat, SSR), 因其多态性高、共显性遗传、易检测等优点, 近年来越来越多地应用于群体遗传分析[10-11]、遗传育种优化[12-13]等研究中, 且其实验结果不易受环境影响[14], 能够弥补宏观群体分类鉴别方法的局限性。
目前, 国内外学者在金乌贼的洄游分布[2-3, 15]、食性[16-17]、形态学[16, 18-19]、行为学[20-21]、繁殖策略[22]和增殖技术[23-24]等方面开展了多项研究, 但有关其产卵洄游历时长、“先期大后期小”的结群现象及分批产卵繁殖习性的研究尚未见报道。本研究通过对青岛近岸不同洄游时期金乌贼群体的13个形态学指标进行多元统计分析, 同时应用微卫星标记技术检测其遗传分化水平, 旨在揭示前、中、后期洄游至近岸产卵场繁殖群体的亲缘关系和遗传结构, 为其繁殖行为特征及繁殖策略研究提供参考。
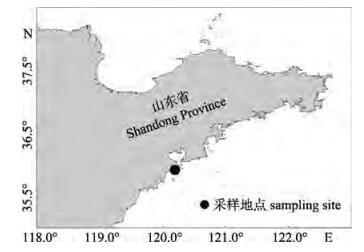
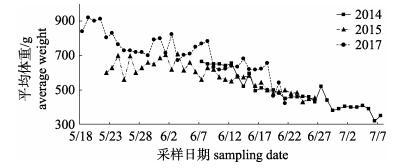
1 材料与方法 1.1 材料实验用金乌贼亲体样本均采自青岛薛家岛近岸水域(35°55'30''N, 120°15'E), 水深15~21 m, 泥沙底质, 水质良好(图 1)。根据近3年青岛薛家岛近海金乌贼的渔情状况,结合当地渔民的走访调查及已发表的期刊文献,明确青岛近海金乌贼亲体的产卵结群期(5月中旬—7月中旬,约60 d)。于2014年、2015年和2017年近岸亲体的结群繁殖期内, 连续采集地笼网渔获物, 记录不同洄游时期金乌贼群体平均体重的变化(图 2)。针对2017年的样本, 于繁殖前、中、后(以约20 d为间隔) 3个时期分别随机抽测约30只样本, 测量其形态学特征并取肌肉组织以便后续分子鉴定。
|
图 1 金乌贼调查采样区域 Fig.1 The sampling stations of Sepia esculenta |
|
图 2 2014年、2015年和2017年薛家岛近海金乌贼产卵群体平均体重的日变化 Fig.2 Change trend of average body weight of Sepia esculenta spawning stock in coastal waters of Xuejia Island in 2014, 2015 and 2017 |
采用传统形态学测量方法, 对金乌贼样本的胴长(ML)、头长(HL)、头宽(HW)、胴宽(MW)、胴背长(DML)、鳍长(FL)、鳍宽(FW)、右1腕长(TLR1)、右2腕长(TLR2)、右3腕长(TLR3)、右4腕长(TLR4)、触腕长(TL)、穗长(TCL)等13个形态特征进行直接测量, 精确至0.1 mm。绝对繁殖力的统计采用质量比例法。首先随机称取卵粒3~4 g (卵巢前、中、后部卵粒混合),统计其数量并结合卵巢总重运用质量比例计算绝对繁殖力。
1.2.2 数据处理采用主成分分析、判别分析、聚类分析和单因子方差分析4种多元统计分析方法, 对不同时期金乌贼样本的形态学指标进行分析, 为校正样本规格差异对形态学参数产生影响, 将12个形态学指标分别除以胴长, 得到12组量度特征值, 应用SPSS 19.0软件进行分析。
(1) 主成分分析。运用SPSS 19.0软件对12组量度特征值进行主成分分析(principal component analysis), 得到各主成分的特征值和贡献率, 并根据第一、第二主成分得分绘制散点图。
(2) 聚类分析。运用SPSS 19.0软件对12组量度特征值进行聚类分析(cluster analysis), 采用组间联接的聚类方法, 构建基于平方Euclidean距离系数的聚类关系树。
(3) 判别分析。运用SPSS 19.0软件对12组量度特征值进行判别分析(discriminant analysis), 计算不同群体的判别准确率及综合准确率并构建判别方程式, 同时基于前两个判别函数值绘制散点图。其中:
判别准确率(%)=(判别正确个体数/群体总个体数)×100%
| $ 综合判别准确率\left( \% \right) = \sum\limits_{i = 1}^n {{R_i}} /\sum\limits_{i = 1}^n {{T_i}} \times 100\% $ |
其中, n表示不同洄游时期(n=3), Ri表示第i个洄游时期群体判别正确个体数, Ti表示第i个洄游时期群体总个体数。
(4) 单因子方差分析 使用SPSS 19.0软件对12组形态学指标进行单因子方差分析(one-way ANOVA), 具方差齐性的变量采用LSD法, 不具方差齐性的变量采用Tamhane’s T2法分析, 差异显著性水平α=0.05。
1.3 微卫星标记 1.3.1 样本基因组DNA提取样本基因组DNA使用苯酚氯仿抽提法[25]提取, 置-20℃冰箱中保存备用。
1.3.2 PCR分析本实验采用5个高度多态的微卫星位点(J17[26]、J63[26]、Secu113[27]、Secu117[27]、Secu164[27]) (表 1)对所提取的金乌贼基因组DNA进行PCR扩增。PCR反应体系为25 μL, 包括Taq酶0.15 μL, DNA模板1 μL, 正、反向引物各1 μL, dNTP 2 μL, 10×PCR buffer 2.5 μL和去离子水17.5 μL。每组PCR均设置阴性对照, 除不加DNA工作液外, 其他条件与正常反应相同, 用以检测是否存在污染。PCR循环参数为: 95℃变性5 min, 随后进行40个循环, 每个循环包括: 94℃变性45 s, 退火45 s (各引物退火温度见表 1), 72℃延伸45 s, 循环完成后72℃延伸10 min, 然后4℃恒温保存。
|
|
表 1 本研究使用的5对微卫星荧光引物信息 Tab.1 Information for 5 microsatellite loci and primers in multiple paternity study of Sepia esculenta |
PCR产物经琼脂糖凝胶电泳检测后, 送生物公司电泳分型。使用GeneMarker v202软件读取相关等位基因数值, 人工校正后, 得到各位点数据。为避免光线直射影响实验结果, 所有实验操作过程均在光线较弱的地方进行。
1.3.3 数据处理运用PopGene 32软件进行群体遗传分析, 计算等位基因数(Na)、有效等位基因数(Ne)、观测杂合度(Ho)和期待杂合度(He)。利用MS tools计算位点的多态信息含量(PIC)、GENEPOP 4.0进行Hardy-Weinberg平衡检验, 如位点显著偏于平衡则运用Micro-Checker检测其是否存在无效等位基因。遗传分化指数(Fst)由FSTAT软件统计分析, 运用ARLEQUIN进行群体间分子方差分析(AMOVA), 利用STRUCTURE分析群体遗传结构, POPULATION 1.2软件计算群体间遗传距离(DA), 运用GENETIX软件进行三维因子对应分析(3D-FCA)。
2 结果与分析 2.1 形态学结果 2.1.1 各时期的金乌贼样本信息2017年采集的不同时期金乌贼群体信息如表 2所示。随时间推移, 金乌贼群体的平均胴长和平均体重均呈下降趋势且具显著差异(P < 0.05)。前期群体的绝对繁殖力显著高于中、后期群体, 3个时期群体的肥满度差异较小。
|
|
表 2 金乌贼样品信息及各时期水温状况 Tab.2 Sample information of Sepia esculenta and the water temperature in each period |
不同时期金乌贼群体的主成分分析结果显示, 前3个主成分分别解释总变异的36.139%、15.110%和8.818%, 累积贡献率为60.067%, 低于85%。第一主成分中, 右1腕长/胴长(TLR1/ML)、右2腕长/胴长(TLR2/ML)、右3腕长/胴长(TLR3/ML)的载荷值较大, 主要体现其头部差异; 第二和第三主成分中, 胴宽/胴长(MW/ML)、胴背长/胴长(DML/ML)、鳍宽/胴长(FW/ML)较大, 主要体现其胴部差异(表 3)。
|
|
表 3 不同洄游时期金乌贼群体主成分分析结果 Tab.3 Results of principal component analysis of breeding populations of Sepia esculenta in different migratory periods |
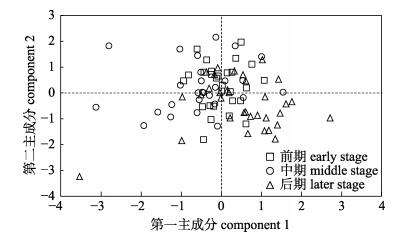
根据第一和第二主成分得分绘制散点图(图 3), 结果显示洄游前期金乌贼群体多数分布于散点图的上侧区域, 中期群体多分布于左侧和上侧区域, 而后期群体多分布于右侧和下侧区域, 三者具较明显的重叠区域。
|
图 3 不同洄游时期金乌贼繁殖群体第一、第二主成分散点图 Fig.3 Scatter plots of scores on the first two principal components of breeding populations of Sepia esculenta in different migratory periods |
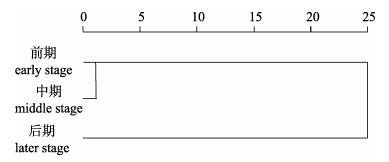
不同时期金乌贼繁殖群体的聚类分析结果表明, 3个时期的金乌贼群体可以大致分为2组, 其中前期和中期群体首先聚为一支, 而后与后期群体聚到一起(图 4)。
|
图 4 金乌贼群体聚类关系树 Fig.4 Dendrogram showing the relationship of Sepia esculenta populations |
运用判别分析方法对不同时期金乌贼繁殖群体进行分析, 结果表明, 3个时期的综合判别正确率为76.1%。其中, 前期群体中有3个体错判为中期群体, 2个体错判为后期群体, 判断正确率为82.1%;中期群体中有5个体错判为前期群体, 4个体错判为后期群体, 正确率为66.7%;后期群体中有4个体错判为前期群体, 3个体错判为中期群体, 正确率78.8% (表 4)。各群体的判别方程式为:
|
|
表 4 不同洄游时期金乌贼群体判别分析结果 Tab.4 Discriminant results of breeding populations of Sepia esculenta in different migratory periods |
前期
| $ \begin{array}{l} Y = 116{x_1} + 70{x_2} - 112{x_3} + 628{x_4} + 97{x_5} - 19{x_6} - \\ \;\;\;90{x_7} + 88{x_8} + 141{x_9} + 32{x_{10}} - 23{x_{11}} - 85{x_{12}} - 429 \end{array} $ |
中期
| $ \begin{array}{l} Y = 77{x_1} + 103{x_2} - 107{x_3} + 611{x_4} + 88{x_5} - 17{x_6} - \\ \;\;\;\;\;\;96{x_7} + 87{x_8} + 131{x_9} + 29{x_{10}} - 19{x_{11}} - 70{x_{12}} - 404 \end{array} $ |
后期
| $ \begin{array}{l} Y = 116{x_1} + 110{x_2} - 142{x_3} + 608{x_4} + 90{x_5} - 3{x_6} - \\ \;\;\;117{x_7} + 115{x_8} + 140{x_9} + 34{x_{10}} - 15{x_{11}} - 54{x_{12}} - 423 \end{array} $ |
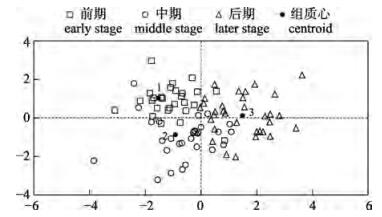
不同时期金乌贼群体的判别分析散点图结果显示, 前期和中期群体普遍位于散点图的左侧, 后期群体多分布于散点图右侧, 各群体并未明显占据不相重叠的区域(图 5)。
|
图 5 基于前两个判别函数值的散点图 1:前期; 2:中期; 3:后期. Fig.5 Scatter plot based on the first two discriminant functions 1: early stage; 2: middle stage; 3: later stage. |
运用单因子方差分析方法对不同时期金乌贼群体的12个量度特征值进行比较, 结果显示, 洄游前期群体与中期群体和后期群体均存在6个指标差异显著(P < 0.05), 中期群体与后期群体存在5个指标差异显著(P < 0.05) (表 5)。
|
|
表 5 不同洄游时期金乌贼繁殖群体单因子方差分析结果 Tab.5 One-way ANOVA results of breeding populations of Sepia esculenta in different migratory periods |
微卫星标记结果显示, 5对微卫星引物在3个群体中均得到较好的扩增并具高度多态性(PIC > 0.5)。各位点的扩增结果见表 6。其中, 等位基因数(Na)为13~25, 有效等位基因数(Ne)为5.68~14.46, 观测杂合度(Ho)介于0.73~0.89之间, 期待杂合度(He)介于0.83~0.94之间, Shannon指数(I)为1.97~2.87, Hardy-Weinberg平衡检验显示前期洄游群体在Secu164位点极显著偏离平衡(P < 0.01), 经Micro- Checker检测存在无效等位基因。
|
|
表 6 金乌贼5对微卫星位点的等位基因数、杂合度及多态信息含量 Tab.6 Number of alleles, heterozygosity and polymorphic information content of 5 microsatellite loci of Sepia esculenta |
各时期金乌贼群体的遗传多样性参数详见表 7, 其中, 前期群体除观测杂合度(Ho)外各项指数均为最高, 中期群体的等位基因数(Na)最低, 后期群体的有效等位基因数(Ne)、Shannon指数(I)、期待杂合度(He)和多态信息含量(PIC)最低, 观测杂合度(Ho)最高。总体上, 不同时期金乌贼群体的遗传多样性水平相仿, 前期群体稍高于中期和后期群体。
|
|
表 7 不同洄游时期金乌贼繁殖群体的遗传多样性 Tab.7 Genetic diversity of breeding populations of Sepia esculenta in different migratory periods |
不同时期金乌贼群体间的Nei’s遗传距离(DA)介于0.12~0.16之间, 前期和中期群体的DA较远(0.16), 中期和后期群体的DA最近(0.12)。3个群体间的遗传分化指数均较低(0.0014~0.0064), 遗传分化水平较低(Fst < 0.05)且差异不显著(P > 0.05) (表 8)。分子方差分析(AMOVA)结果如表 9所示, 如将3个时期的群体定义为不同的管理单元, 则群体间的遗传变异为0.16%, 群体内的遗传变异为99.84%, 且两者差异不显著(P > 0.05)。
|
|
表 8 不同洄游时期金乌贼繁殖群体的遗传距离(DA, 对角线以上)和遗传分化指数(Fst, 对角线以下) Tab.8 Genetic distance (DA, above diagonal) and pairwise Fst estimates (Fst, below diagonal) of breeding populations of Sepia esculenta in different migratory periods |
|
|
表 9 不同洄游时期金乌贼繁殖群体分子方差分析 Tab.9 AMOVA analysis of breeding populations of Sepia esculenta in different migratory periods |
利用Structure 2.3.1执行1~3的假设K值, 每个K值重复模拟10次, 根据K值的趋势分析, 判断最佳的理论组群为1。图 6和图 7所示分别为选择K=2和K=3时的金乌贼不同洄游时期遗传结构图, 其结果显示, 若假定K个理论组群, 则各个洄游时期的群体都会均匀地分到K个组群中。

|
图 6 K=2时金乌贼不同洄游时期的遗传结构图 Fig.6 Cluster analysis for Sepia esculenta from structure (K=2) |

|
图 7 K=3时金乌贼不同洄游时期的遗传结构图 Fig.7 Cluster analysis for Sepia esculenta from structure (K=3) |
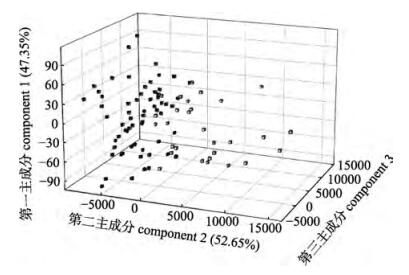
3D-FCA分析结果显示, 第一主成分和第二主成分分别解释总遗传变异的47.35%和52.65%, 3个不同洄游时期的群体存在较多的重叠区域(图 8)。
|
图 8 不同洄游时期金乌贼群体的3D-FCA分析 红色:前期; 蓝色:中期; 黄色:后期. Fig.8 3D-FCA analysis of breeding populations of Sepia esculenta in different migratory periods red: early stage; blue: middle stage; yellow: later stage. |
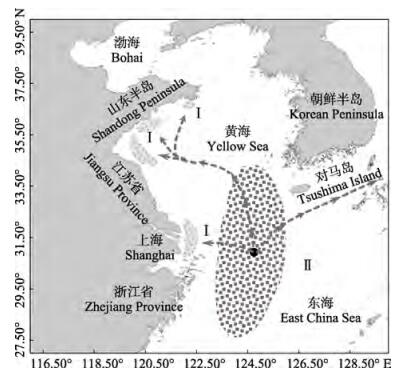
据报道, 我国近海金乌贼可分为3个群体, 冬季均于黄海中南部、台湾北部及对马五岛西南海域中混栖越冬(图 9), 经长达4个月的生长发育后, 自越冬场呈辐射状向近岸各产卵场生殖洄游, 第一个群体游向舟山、长江口海域, 并在两者的内湾和岛湾结群生殖; 第二个群体经对马海峡向日本海洄游; 最后一个群体游至海州湾近海、青岛及石岛近岸[3]。其产卵洄游路线可能不会严格与越冬路线重叠, 因此导致不同群体的交叉汇合[4]。研究表明, 具分批产卵习性的头足类, 其体内往往仅储存少量能量用于性腺的生长发育, 因此在其生殖期间需不断进食以满足生殖能量的支出[29], 故饵料丰富度是影响其繁殖习性、生活史策略和产卵场选择的重要因子之一。不同于太平洋褶柔鱼(Ommastrephes sloani pacificus)的季节性洄游, 春夏季时期金乌贼完全是一种生殖洄游, 其目的性极强, 因此适宜的产卵生境对其在近岸水域的洄游分布影响极大。当其进行生殖洄游时, 洄游通路中饵料丰富度、受精卵附着物的有无等可能显著影响其对产卵场的选择倾向。青岛近岸结群的金乌贼群体属自越冬场向北洄游的一支, 但亦可能混有向日本海洄游的群体以及本应结群于长江口、舟山近海的群体, 由此推测, 同一群体的产卵场不一致, 而同一产卵场亦可能结群有不同的群体。
|
图 9 金乌贼的越冬场及洄游路线(参考郑元甲等[3]) Ⅰ:产卵场; Ⅱ:越冬场. Fig.9 The overwintering and migratory routes of Sepia esculenta Ⅰ: spawning grounds; Ⅱ: wintering grounds. |
主成分分析结果显示, 前3个主成分的累积贡献率为60.067% (表 3), 低于85%[6], 表明不同洄游时期金乌贼繁殖群体的形态参数差异较小, 无法运用主成分分析方法进行区分。判别分析结果显示, 3个群体的判别准确率介于66.7%~82.1%, 整体判别准确率较低, 各时期的繁殖群体在主成分分析和判别分析的散点图中均未明显占据不相重叠的区域, 表明3个时期金乌贼繁殖群体的形态量度特征较为接近。
微卫星标记通过对特定基因片段进行特异性扩增, 统计分析其长度、纯合度和杂合度等信息, 以量化群体间的遗传分化程度。本研究中应用的5对微卫星引物的PIC值介于0.79~0.91, 具高度多态性(PIC > 0.5), 应用其对金乌贼基因片段进行特异性扩增, 共计得到104个等位基因, 平均单个位点得到20.8个等位基因。遗传多样性作为生物多样性的重要组成, 体现着物种对环境变化适应能力的强弱[30]。不同洄游时期群体观测杂合度(Ho, 0.77~0.81)、期待杂合度(He, 0.89~0.90)及PIC (0.86~0.87)等均较高, 表现出较高水平的遗传多样性, 这与Zheng等[31]利用微卫星技术研究中国及日本5个金乌贼群体的遗传多样性水平相似, 高于同为乌贼科的虎斑乌贼[32](Sepia pharaaonis) (Ho, 0.30~0.83; He, 0.704~0.859)和蛸科的真蛸[33] (Octopus vulgaris) (Ho, 0.664~0.837; He, 0.835~ 0.909)。根据Wright[34]的遗传分化理论, Fst < 0.05代表遗传分化水平较低。本研究中, 不同洄游时期金乌贼繁殖群体间的遗传距离DA介于0.12~ 0.16, 遗传分化较低(Fst, 0.0014~0.0064)。同时, 其遗传结构分析和3D-PCA分析结果亦表明, 不同洄游时期的金乌贼繁殖群体不能明显区分为不同的管理单元。
不同洄游时期金乌贼繁殖群体的规格相差较大, 但形态学参数差异较小, 遗传距离较近, 遗传结构相似, 未呈现明显的群体分化。分析认为, 金乌贼繁殖群体规格差异较大的主要原因, 是由于亲体分批产卵、仔乌分批孵化导致生长离散的加剧所致。受资源、生境等影响, 生长离散本是生物群体中一个正常现象[35], 金乌贼前期产卵孵化的仔乌在适宜的水温条件下生长迅速, 而后期孵化的个体, 在生长初期便面临高温胁迫与越冬洄游的挑战, 由此进一步加剧了生长离散的程度。规格大小决定的游泳能力强弱, 使得大规格个体先期到达产卵场, 小规格个体后期在近岸水域结群繁殖。研究表明, 在东、黄海混群越冬的金乌贼规格由北部近海向北部外海、南部近海及南部外海呈逐渐减小趋势[3], 为了避免饵料竞争, 鱼类往往会通过增大空间生态位分化以降低捕食压力[36], 金乌贼在越冬场长达4个月的生长发育过程中, 小规格个体必然会尽量避免与大规格个体越冬栖息地的重叠, 因此, 越冬场距产卵场的远近亦可能是影响其“产卵结群历时长、前期个体大后期个体小”的因素之一。据此, 本文建议在开展金乌贼增殖放流时, 尽量采用前期洄游亲体进行人工繁育, 因前期洄游亲体具有更高的怀卵量(表 2), 其孵化的仔乌具有更长的适宜生长期, 能够避开后期近岸水域高温的不良影响, 在越冬洄游之前即具较大的规格和较高的活力(如捕食能力、游泳能力及极端条件耐受能力等),在增加资源补充效应的同时亦能提高渔业生产效益。
4 小结许多研究表明, 同一物种的不同群体在形态学和遗传分化水平上具不可预测性, 如Thakur等[37]研究显示辽宁大连和山东俚岛的2个大头鳕(Gadus Macrocephalus)群体形态参数较为相似, Moghadam等[32]发现美国3个虎斑乌贼群体间的遗传分化水平较低。同时, 不容忽视的是, 形态度量等宏观群体鉴别方法易受生物生存环境的影响[14], 金乌贼不同群体均在黄海混栖越冬长达4个月之久[2], 其越冬场环境的连续甚至一致性是否会引起形态特征的相似尚值得讨论。此外, 具有良好扩散能力的海洋鱼类通常在很大的地理范围内表现出较低的遗传分化[38-40]。因此, 金乌贼的越冬混群及较强的运动能力亦可能导致群体间具有相似遗传结构。
| [1] |
Lei S H. Studies on embryonic and larval development of golden cuttlefish (Sepia esculenta)[D]. Qingdao: Ocean University of China, 2013: 2-3. [雷舒涵.金乌贼胚胎与幼体发育生物学研究[D].青岛: 中国海洋大学, 2013: 2-3.]
|
| [2] |
Li J Y. On the breeding and migration of the golden cuttlefish, Sepia esculenta Hoyle, living in Yellow Sea[J]. Journal of Shandong College of Oceanology, 1963(2): 69-108. [李嘉泳. 金乌贼Sepia esculenta Hoyle在黄渤海的结群生殖和洄游[J]. 山东海洋学院学报, 1963(2): 69-108.] |
| [3] |
Zhen Y J, Chen X Z, Cheng J H, et al. Biological Resources and Environment in the East China Sea Continental Shelf[M]. Shanghai: Shanghai Scientific & Technical Publishers, 2003: 722-727. [郑元甲, 陈雪忠, 程家桦, 等. 东海大陆架生物资源与环境[M]. 上海: 上海科学技术出版社, 2003: 722-727.]
|
| [4] |
Yamada U, Tagawa M, Kishita S, et al. Fishes of the East China Sea and the Yellow Sea[M]. Nagasaki: Seikai National Fisheries Research Laboratory, 1986: 208-461.
|
| [5] |
Frédérich B, Liu S Y V, Dai C F. Morphological and genetic divergences in a coral reef damselfish, Pomacentrus coelestis[J]. Evolutionary Biology, 2012, 39(3): 359-370. |
| [6] |
Xu S Y, Zhang H, Liu B Z, et al. Morphological study of Sebastiscus marmoratus among populations in China and Japan[J]. Acta Hydrobiologica Sinica, 2013, 37(5): 960-966. [徐胜勇, 张辉, 柳本卓, 等. 中日褐菖鲉群体形态学比较研究[J]. 水生生物学报, 2013, 37(5): 960-966.] |
| [7] |
Han Z, Xiao Y S, Gao T X. Comparison of morphological characteristics of 9 Larimichthys polyactis populations in China[J]. South China Fisheries Science, 2012, 8(3): 25-33. [韩真, 肖永双, 高天翔. 中国近海9个小黄鱼群体的形态学比较研究[J]. 南方水产科学, 2012, 8(3): 25-33. DOI:10.3969/j.issn.2095-0780.2012.03.004] |
| [8] |
Mwanja M T, Muwanika V, Nyakaana S, et al. Population morphological variation of the Nile perch (Lates niloticus, L. 1758), of East African Lakes and their associated waters[J]. African Journal of Environmental Science and Technology, 2011, 5(11): 941-949. |
| [9] |
Cavalcanti M J, Monteiro L R, Lopes P R D. Landmark-based morphometric analysis in selected species of serranid fishes (Perciformes: Teleostei)[J]. Zoological Studies, 1999, 38(3): 287-294. |
| [10] |
Sun C F, Ye X, Dong J J, et al. Genetic diversity analysis of six cultured populations of Macrobrachium rosenbergii using microsatellite markers[J]. South China Fisheries Science, 2015, 11(2): 20-26. [孙成飞, 叶星, 董浚键, 等. 罗氏沼虾6个养殖群体遗传多样性的微卫星分析[J]. 南方水产科学, 2015, 11(2): 20-26. DOI:10.3969/j.issn.2095-0780.2015.02.003] |
| [11] |
Liu L W, Chen X J, Xu Q H, et al. Isolation and genetic diversity of microsatellite DNA of Ommastrephes bartramii in the North Pcific Ocean[J]. Acta Ecology Sinica, 2014, 34(23): 6847-6854. [刘连为, 陈新军, 许强华, 等. 北太平洋柔鱼微卫星标记的筛选及遗传多样性[J]. 生态学报, 2014, 34(23): 6847-6854.] |
| [12] |
Wolfus G M, Garcia D K, Alcivar-Warren A. Application of the microsatellite technique for analyzing genetic diversity in shrimp breeding programs[J]. Aquaculture, 1997, 152(1-4): 35-47. DOI:10.1016/S0044-8486(96)01527-X |
| [13] |
Chareontawee K, Poompuang S, Na-Nakorn U, et al. Genetic diversity of hatchery stocks of giant freshwater prawn (Macrobrachium rosenbergii) in Thailand[J]. Aquaculture, 2007, 271(1-4): 121-129. DOI:10.1016/j.aquaculture.2007.07.001 |
| [14] |
Zhang Q Q, Chen J, Jiang X Y, et al. Establishment of DNA fingerprinting and analysis on genetic structure of different Parabramis and Megalobrama populations with microsatellite[J]. Journal of Fisheries of China, 2014, 38(1): 15-22. [张倩倩, 陈杰, 蒋霞云, 等. 不同鳊鲂鱼类群体微卫星DNA指纹图谱的构建和遗传结构分析[J]. 水产学报, 2014, 38(1): 15-22.] |
| [15] |
Dong Z Z. On the geographical distribution of the cephalopods in the chinese waters[J]. Oceanologia et Limnologia Sinica, 1978, 9(1): 108-118. [董正之. 中国近海头足类的地理分布[J]. 海洋与湖沼, 1978, 9(1): 108-118.] |
| [16] |
Natsukari Y, Tashiro M. Neritic squid resources and cuttlefish resources in Japan[J]. Marine and Freshwater Behaviour and Physiology, 1991, 18(3): 149-226. DOI:10.1080/10236249109378785 |
| [17] |
Cheng J S, Zhu J S. Study on feeding characteristics and trophic levels of main economic invertebrates in the Yellow Sea[J]. Acta Oceanologia Sinica, 1997, 19(6): 102-108. [程济生, 朱金声. 黄海主要经济无脊椎动物摄食特征及其营养层次的研究[J]. 海洋学报, 1997, 19(6): 102-108.] |
| [18] |
Wei L Z. Biology of Sepia esculenta in the coastal waters of Rizhao[D]. Qingdao: Ocean University of China, 2005: 2-3. [韦柳枝.山东日照近海金乌贼生物学研究[D].青岛: 中国海洋大学, 2005: 2-3.]
|
| [19] |
Yagi T. On the growth of the shell in Sepia esculenta Hoyle caught in Tokyo Bay[J]. Bulletin of the Japanese Society of Scientific Fisheries, 1960, 26(7): 646-652. DOI:10.2331/suisan.26.646 |
| [20] |
Wei Z B. Preliminary observation of S. esculenta habits[J]. Chinese Journal of Zoology, 1964, 12(3): 132-134. [魏臻邦. 金乌贼生活习性的初步观察[J]. 动物学杂志, 1964, 12(3): 132-134.] |
| [21] |
Hao Z L. Studies on the behavior and marking technology of Sepia esculenta[D]. Qingdao: Ocean University of China, 2007: 61-67. [郝振林.金乌贼的行为习性及标志技术的研究[D].青岛: 中国海洋大学, 2007: 61-67.]
|
| [22] |
Wang L, Zhang X M, Ding P W, et al. Reproductive behavior and mating strategy of Sepia esculenta[J]. Acta Oceanologia Sinica, 2017, 37(6): 1871-1880. [王亮, 张秀梅, 丁鹏伟, 等. 金乌贼繁殖行为与交配策略[J]. 生态学报, 2017, 37(6): 1871-1880.] |
| [23] |
Zhao H J, Wei B F, Hu M, et al. Preliminary study on Sepia esculenta oosperm hatching and effects of different adhesion substrates[J]. Transactions of Oceanology and Limnology, 2004, 64(3): 64-68. [赵厚钧, 魏邦福, 胡明, 等. 金乌贼受精卵孵化及不同材料附着基附卵效果的初步研究[J]. 海洋湖沼通报, 2004, 64(3): 64-68. DOI:10.3969/j.issn.1003-6482.2004.03.011] |
| [24] |
Fujita T, Hirayama I, Matsuoka T, et al. Spawning behavior and selection of spawning substrate by cuttlefish Sepia esculenta[J]. Bulletin of the Japanese Society of Scientific Fisheries, 1997, 63(2): 145-151. DOI:10.2331/suisan.63.145 |
| [25] |
Sambrook J, Russell D W. Molecular Cloning: A Laboratory Manual, 3rd edition[M]. New York: Cold Spring Harbor Laboratory Press, 2001: 479-482.
|
| [26] |
Yuan Y J, Liu S F, Bai C C, et al. Isolation and characterization of new 24 microsatellite DNA markers for golden cuttlefish (Sepia esculenta)[J]. International Journal of Molecular Sciences, 2012, 13(1): 1154-1160. DOI:10.3390/ijms13011154 |
| [27] |
Zheng X D, Ikeda M, Barinova A. Isolation and characterization of microsatellite DNA loci from the golden cuttlefish, Sepia esculenta Hoyle (Cephalopoda)[J]. Molecular Ecology Notes, 2007, 7(1): 40-42. |
| [28] |
Yasuda J. Some ecological note on the cuttlefish, Sepia esculenta Hoyle[J]. Nihon-Suisan-Gakkai-Shi, 1951, 16(8): 350-356. DOI:10.2331/suisan.16.350 |
| [29] |
Mcgrath B, Jackson G. Egg production in the arrow squid Nototodarus gouldi (Cephalopoda: Ommastrephidae), fast and furious or slow and steady?[J]. Marine Biology, 2002, 141(4): 699-706. |
| [30] |
Lou A R, Sun R Y, Li Q F, et al. Basic Ecology[M]. Beijing: Higher Education Press, 2002: 24-25. [娄安如, 孙濡泳, 李庆芬, 等. 基础生态学[M]. 北京: 高等教育出版社, 2002: 24-25.]
|
| [31] |
Zheng X D, Ikeda M, Kong L F, et al. Genetic diversity and population structure of the golden cuttlefish, Sepia esculenta(Cephalopoda: Sepiidae) indicated by microsatellite DNA variations[J]. Marine Ecology, 2009, 30(4): 448-454. DOI:10.1111/mae.2009.30.issue-4 |
| [32] |
Moghadam H Y, Zolgharnein H, Aliabadi M A, et al. Genetic analysis of cuttlefish Sepia Pharaonis (Ehrenberg, 1831) populations in persian gulf with microsatellite makers[J]. Journal of Shellfish Research, 2015, 34(2): 1-5. |
| [33] |
Cabranes C, Fernandez-Rueda P, Martinez J L. Genetic structure of Octopus vulgaris around the Iberian Peninsula and Canary Islands as indicated by microsatellite DNA variation[J]. ICES Journal of Marine Science, 2008, 65(1): 12-16. |
| [34] |
Wright S. Ecolution and the Genetics of Populations[M]. Chicago: University of Chicago Press, 1968: 373-375.
|
| [35] |
Zhuang P, Li D P, Wang M X, et al. Effect of stocking density on growth of juvenile Acipenser schrenckii[J]. Chinese Journal of Applied Ecology, 2002, 13(6): 735-738. [庄平, 李大鹏, 王明学, 等. 养殖密度对史氏鲟稚鱼生长的影响[J]. 应用生态学报, 2002, 13(6): 735-738. DOI:10.3321/j.issn:1001-9332.2002.06.022] |
| [36] |
Pratchett M S, Berumen M L. Interspecific variation in distributions and diets of coral reef butterflyfishes (Teleostei: Chaetodontidae)[J]. Journal of Fish Biology, 2008, 73(7): 1730-1747. DOI:10.1111/jfb.2008.73.issue-7 |
| [37] |
Thakur D, Xu S Y, Lu Z C, et al. Morphological variation among populations of Gadus Macrocephalus from Bohai Sea and Yellow Sea[J]. Transactions of Oceanology and Limnology, 2015(3): 97-107. |
| [38] |
Grant W S, Bowen B W. Shallow population histories in deep evolutionary lineages of marine fishes: insights from sardines and anchovies and lessons for conservation[J]. Journal of Heredity, 1998, 89(5): 415-426. DOI:10.1093/jhered/89.5.415 |
| [39] |
Hewitt G M. The genetic legacy of the quaternary ice ages[J]. Nature, 2000, 405(6789): 907-913. DOI:10.1038/35016000 |
| [40] |
Palumbi S R. Genetic divergence, reproductive isolation, and marine speciation[J]. Annual Review of Ecology and Systematics, 1994, 25: 547-572. DOI:10.1146/annurev.es.25.110194.002555 |
 2019, Vol. 26

