2. 青岛海洋科学与技术试点国家实验室, 海洋渔业科学与食物产出过程功能实验室, 山东 青岛 266237
2. Laboratory for Marine Fisheries Science and Food Production Processes, Pilot National Laboratory for Marine Sci-ence and Technology, Qingdao 266237, China
渔业资源评估有赖于可靠的数据支撑。一般而言渔业资源评估数据有两种来源, 即科学调查数据和渔业生产数据。前者需要定期出海采样, 耗时长且费用高, 后者易于获取但样本代表性及数据精确度有一定的不足[1-2]。对于许多区域性渔业而言, 由于研究关注度和资金的不足, 相关数据往往较为稀少, 即称为数据贫乏渔业(data- poor-fisheries)。如何有效地利用渔业生产数据, 以较低的成本获取准确的资源评估结果, 是科学管理数据贫乏型渔业的重要问题。
口虾蛄(Oratosquilla oratoria)属于节肢动物门(Arthropoda), 软甲纲(Malacostraca), 口足目(Stomatopoda), 虾蛄科(Squilidae), 口虾蛄属(Oratosquilla)[3]。是一种广泛分布于热带、亚热带及温带海域多年生甲壳类, 其分布海域包括中国沿海、日本沿海及菲律宾沿岸[4-5]。口虾蛄不是传统的渔业目标物种, 但近年来随着渔业资源的衰退, 目前已成为中国沿海重要的渔业物种之一[6], 其中以黄渤海产量最大[7]。
以往对口虾蛄的研究主要集中在种群遗传学、资源特征的变化、外部形态特征和人工育苗、生长、繁殖和摄食等方面[4-17]。如张代臻等[10]对比了黄海6个口虾蛄种群的遗传多样性特征; 潘国良等[11]研究了浙江南部近岸海域口虾蛄生物量的时间变化与温度、盐度等环境因子的关系, Kim等[8]及刘海映等[15]分别对韩国Tongyeong地区和大连市口虾蛄的繁殖特征进行了分析。但是目前对于口虾蛄生物学的研究不系统, 制约着口虾蛄渔业资源的科学评估和管理。
本研究基于山东近海科学调查与渔业生产所获得的数据, 比较了两种数据估算口虾蛄生长参数的差异, 旨在研究不同的数据来源对计算口虾蛄生长参数的影响, 以期为相关研究提供较为经济和准确的数据获取方式, 为准确评估山东近海口虾蛄的生长提供技术支撑。
1 材料与方法 1.1 样品采集本研究采用的口虾蛄科学调查数据来源于2016年10月、2017年1月、5月和8月在山东近海进行的底拖网渔业调查, 调查船为220 kW的单拖渔船, 网具为1380目×4.67 cm的底拖网, 拖网时网口高度约为7.53 m, 宽约15 m。4次调查共捕获口虾蛄5028尾, 其中10月568尾, 1月674尾, 5月2489尾, 8月1297尾。
口虾蛄的渔业生产数据通过多个地区港口调查获得, 包括青岛、潍坊、日照、文登、东营、烟台和滨州, 共收集了2018年1月、3月、4月、9月和10月的渔业生产数据。由于渔业生产数据收集在实践中的复杂性, 最终获得的样本量较小, 共311尾, 其中1月32尾, 3月49尾, 4月54尾, 9月120尾, 10月56尾。
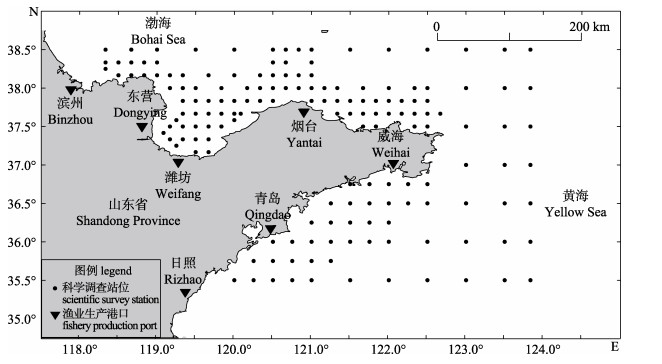
科学调查的站位及渔业生产港口调查点如图 1所示。将所捕获和采集的样本冰冻保存带回实验室进行生物学测定, 样品的处理和分析按照《海洋调查规范》[18]进行, 分别用精度1 mm的测量尺和精度0.01 g的电子天平测量体长L (mm)和体重W (g)。

|
图 1 山东近海口虾蛄调查站位 Fig.1 Sampling stations of Oratosquilla oratoria in Shandong offshore |
首先采用幂函数拟合口虾蛄体长和体重关系, 其表达式为
| $ W = a{L^b} $ |
式中, W表示口虾蛄的体重(g); L表示口虾蛄的体长(mm); a为生长条件因子; b为幂指数。
根据两种调查方法所测定的生物学数据, 分别计算口虾蛄的体长频率组成, 通过电子体长频率分析法(electronic length frequency analysis, ELEFAN)[19]来估算生长参数
| $ {L_t} = {L_\infty }\left[ {1 - {{\rm{e}}^{ - K\left( {t - {t_0}} \right) - \frac{{CK}}{{2{\rm{ \mathit{ π} }}}}\sin \left( {2{\rm{ \mathit{ π} }}\left( {t - {t_s}} \right)} \right)}}} \right] $ |
式中,
以体长6 mm为组距进行分组, 绘制口虾蛄的体长频率分布图, 运用ELEFAN计算两种采样方法得到的口虾蛄的生长参数, 同时绘制口虾蛄各季节体长频率分布图, 分析口虾蛄不同季节的体长组成。ELEFAN方法中, 生长曲线拟合优度函数[18]的计算公式为
| $ {R_n} = \frac{{{{10}^{\frac{{{\rm{ESP}}}}{{{\rm{ASP}}}}}}}}{{10}} $ |
式中,ESP为体长频率分布图中理论波峰和的最大值; ASP为可获得的波峰和的最大值。模拟拟合中, 根据
由于科学调查的口虾蛄样本量远大于渔业生产的口虾蛄样本量, 本研究采用bootstrap重抽样的方法对数据进行处理, 以构建相同的样本大小, 消除样本量不同对口虾蛄生物学分析结果的影响。对于渔业生产数据进行有放回的全部抽样; 对于科学调查数据, 按月份进行有放回的分层抽样, 即2016年10月抽取35尾, 2017年1月抽取42尾, 2017年5月抽取154尾, 2017年8月抽取80尾, 共311尾。两种抽样方法各进行1000次, 分别计算每次抽样的生长参数。并应用非参数检验分析通过科学调查和渔业生产数据分别得到的口虾蛄生长参数
数据处理利用R语言软件v3.5.1完成, 利用TropFishR[22]估算口虾蛄的生长参数。
2 结果与分析 2.1 体长组成基于科学调查获得的口虾蛄样本的平均体长为(99.17±24.08) mm, 体长范围为28~176 mm, 优势体长组为76~130 mm, 占科学调查总样本数的71.17%(图 2a)。基于渔业生产数据获得的口虾蛄样本的平均体长为(107.72±25.84) mm, 体长范围为43~163 mm, 优势体长组有2个, 分别为102~ 208 mm和114~120 mm, 优势体长组共占口虾蛄渔业生产总个体数生物22.83% (图 2b)。整体而言, 两类数据中口虾蛄体长有一定差异, 但差异不大。

|
图 2 科学调查数据(a)和渔业生产数据(b)中口虾蛄体长分布 Fig.2 The length distribution of Oratosquilla oratoria in fishery-independent data (a) and fishery-dependent data (b) |
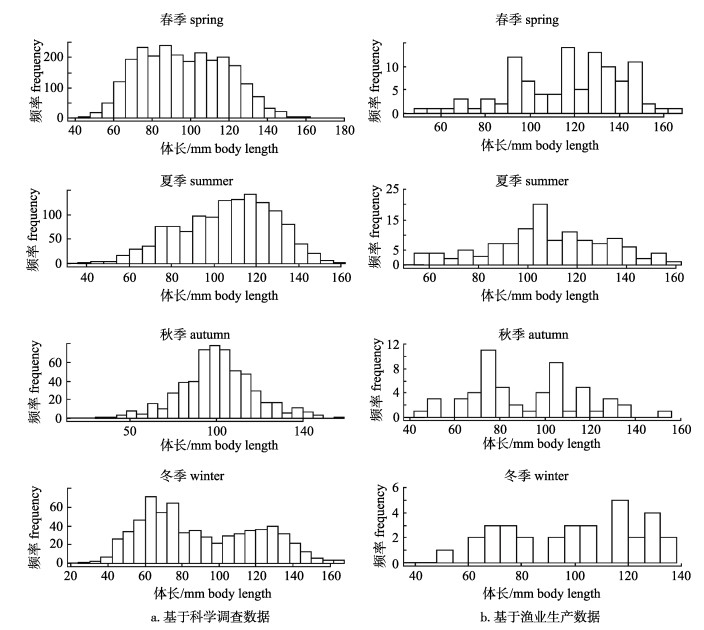
本研究进一步分析了口虾蛄体长的季节性变化。科学调查数据中体长频率季节性分布的规律明显(图 3a), 4个季节体长组数据分布较为连续, 科学调查数据主要集中在中体长组。渔业生产数据在秋季和冬季出现了数据不连续现象, 一部分体长组缺失(图 3b)。渔业生产数据季节性体长频率分布规律不明显。

|
图 3 基于科学调查数据与渔业生产数据的口虾蛄体长季节性分布 Fig.3 The seasonal distribution of the length of Oratosquilla oratoria based on fishery-independent data and fishery-dependent data |
基于科学调查与渔业生产数据得到的口虾蛄体长与体重关系分别为:
由ELEFAN拟合口虾蛄的von Bertalanffy生长方程, 分别得到基于科学调查与渔业生产数据的口虾蛄生长参数

|
图 4 基于科学调查数据和渔业生产数据的口虾蛄生长曲线 Fig.4 The growth curves of Oratosquilla oratoria based on fishery-independent data and fishery-dependent data |
|
|
表 1 基于科学调查数据和渔业生产数据估算的口虾蛄的生长参数与生长方程 Tab.1 Growth equation and parameters of Oratosquilla oratoria estimated based on fishery-independent data and fishery-dependent data |
利用bootstrap重抽样估算了口虾蛄生长参数概率密度图(图 5), 两种采样方法得到的口虾蛄极限体长

|
图 5 基于科学调查数据和渔业生产数据估算的口虾蛄的 |
本研究结果表明, 基于科学调查数据和基于渔业生产数据所估算的口虾蛄的体长-体重关系、生长参数K和“夏季点”ts相差不大, 而极限体长的估计值相差较大。该结果说明有限的渔业生产数据也能在一定程度上反映口虾蛄的生长特性, 对于我们今后收集和分析渔业生产数据具有一定的指导意义。另一方面, 极限体长较大的偏差估计, 可能是因为在运用体长频率数据时, 样本的最大体长对生长参数估算影响较大。本研究科学调查数据中口虾蛄最大体长为176 mm, 估算出的极限体长为193.16 mm; 渔业生产数据中口虾蛄最大体长为163 mm, 所估算的极限体长为171.70 mm。这可能是渔业生产数据较少, 口虾蛄样本代表性弱所导致的[1]。因此在今后的研究中, 若要准确估算生物的极限体长, 需要保证生物的体长分布合理或至少保证大个体渔获物的样本量充足[23]。
本研究建议, 用体长频率法估算生物的生长参数时, 所选择的样本数据要包括种群的各个体长组, 采集的样品不仅要有一定的数量, 而且要有广泛的代表性。若由于渔具选择性[24-25]等原因导致无法获得小样本个体, 如果能够保证样本中最大体长组个体充足, 则仍然能获得较好的极限体长估计值[23]。
本研究综合利用了科学调查数据与渔业生产数据。从总样本量上来讲, 科学调查数据得到的口虾蛄样本量多, 有5028个样本, 渔业生产数据仅有311个样本, 两者相差较大。需要值得注意的是, 在许多发达国家较为成熟的渔业管理体系中该趋势是相反的, 一般渔业生产数据远远多于科学调查数据[26]。这可以归结为历史的原因, 即我国近海大多数渔业缺乏有效的监测体系, 渔业生产数据缺乏[1]。但在国家渔业总量控制的管理策略的要求之下, 渔业生产数据的监测和分析是一个必然的趋势[26]。本研究即为构建近海渔业监测系统的初步尝试, 在收集渔业生产数据方面也遇到了较多的困难。
从本研究获取的数据来看, 科学调查数据获得的口虾蛄样本的季节性体长分布较为规律, 而渔业生产数据中季节性体长分布出现样本缺失。口虾蛄的科学调查数据在空间上较好的覆盖了山东近海区域, 在时间上也有很好的连续性, 故其样本数较多并且可以有效地代表山东近海口虾蛄的状况。渔业生产数据是由各个地区港口调查获得, 一般每个月份调查一次, 受条件所限导致渔业生产样本数较少, 也是导致渔业生产数据体长频率分布出现体长组缺失的原因。此外, 渔业生产得到的口虾蛄缺少高体长组样本和小体长组样本。渔业生产获得的口虾蛄样本的最小体长为43 mm, 最大体长为163 mm; 科学调查获得的口虾蛄样本的最小体长为28 mm, 最大体长为176 mm。这可能是由于网具差异、口虾蛄时空分布特征以及渔民采样策略等原因导致的。由于渔具对渔获物具有一定的选择性, 渔获物很难包括各个长度组的口虾蛄, 低龄或高龄的样品数量可能很少, 甚至没有[21, 24-25]; 有研究表明, 目标种群的时空分布、调查海域的物种多样性也会影响样本的体长频率[27]; 同时, 如果在采样之前渔获物已经经过了分拣, 或丢弃小渔货物或者出售高价值的大个体, 都会导致样本中体长组成出现偏差[28], 这也是今后研究在样本收集时需要注意的问题。
本研究发现体长组距的设定会影响到生物的生长死亡参数的估算, 选择一个合适的组距可以提高体长频率分析的可信度[29]。本研究选择的口虾蛄样本分组组距为6 mm, 以Pauly等[19]提出的拟合优度Rn作为判别标准, 以最佳拟合度对应的生长参数作为所求的生长参数的值, 且该值必须在生物学上能够接受[29]。在不同体长分组组距情况下, 分别基于科学调查所获得全部样本和渔业生产所获得的全部样本, 估算口虾蛄各生物学参数的值以及拟合度Rn, 结果如表 2所示。口虾蛄生长具有明显的季节性, 夏末至秋末生长快速, 其繁殖期为4―9月, 繁殖盛期为5―7月[11]。故选取代表产卵期的参数t-anchor大于0.4, 小于0.6的点, 最终以6 mm作为体长分组的组距。
|
|
表 2 基于口虾蛄科学调查数据和渔业生产数据不同组距情况下各生长参数的值 Tab.2 The value of the parameter with different group spacing based on fishery-independent data and fishery-dependent data of Oratosquilla oratoria |
本研究系统比较了两种数据来源对口虾蛄生长参数估算的影响, 但尚有问题有待进一步探讨。首先有效样本量的大小可能对评估结果有重要影响。本研究以渔业生产数据的311个样本作为重抽样大小, 未涉及抽样样本量的增加对估算口虾蛄生长参数产生的影响。戴黎斌[30]等指出, 不同样本量的大小会影响对生物体长频次估计的精度, 应该针对不同海域、不同种类、不同季节的采样调查, 调整有效样本量的大小, 以达到准确描述目标种群体长结构的目的。同时雌雄个体间的生长特征也可能存在差异。王波等[11]研究表明, 口虾蛄雄性个体比雌性个体略大, 5月中旬雌雄比最大, 此后急剧下降, 雌雄性比差异也可能会造成口虾蛄体长组成的不同。今后应该对这些因素的影响加以深入研究来提高评估结果的精确度, 以更好地为渔业管理提供支撑。
总体而言, 本研究中口虾蛄的渔业生产数据由于数据量小、分布不规律、数据结构受人为影响大[16]、不同渔具对生物的选择性等原因[24-25], 造成目标样本的渔获量、体长组成存在质量问题[31], 不能准确估算口虾蛄的极限体长。而科学调查数据中调查站位多且航次较多, 得到的口虾蛄样本较多, 相对渔业生产数据来说更能准确描述口虾蛄的生长参数, 分析口虾蛄的实际生长状况。本文结果表明, 科学调查是进行科学研究不可缺少的一步, 而渔业生产数据能够在一定程度上反映口虾蛄的生长状况, 对于口虾蛄生长参数K以及“夏季点”ts的估算与科学调查数据较为接近, 但不能保证准确描述口虾蛄的极限体长。因此目前条件下, 渔业生产数据可作为辅助研究, 不能单独使用渔业生产数据评估口虾蛄生长状况。今后的研究中应加大渔业生产数据收集力度, 完善渔业生产监测体系, 更好地服务于渔业资源评估与管理。
| [1] |
Sun W Q, Huang S L. Requirement of the international community on fishery statistics and ponderation over improvement of Chinese fishery statistics[J]. Journal of Shanghai Ocean University, 2009, 18(1): 83-87. [孙雯钦, 黄硕琳. 国际社会对渔业统计的要求以及完善我国渔业统计制度的思考[J]. 上海海洋大学学报, 2009, 18(1): 83-87.] |
| [2] |
He G Y. Several issues research on sampling in fishing production surveys[D]. Qingdao: Ocean University of China, 2015. [何国毅.渔业捕捞产量抽样调查若干问题研究[D].青岛: 中国海洋大学, 2015.]
|
| [3] |
Liu R Y. Checklist of Marine Biota of China Seas[M]. Beijing: Science Press, 2008: 659. [刘瑞玉. 中国海洋生物名录[M]. 北京: 科学出版社, 2008: 659.]
|
| [4] |
Xu L L, Xue Y, Jiao Y, et al. Population structure and spatial distribution of Oratosquilla oratoria in Haizhou Bay and adjacent waters[J]. Periodical of Ocean University of China, 2017, 47(4): 28-36. [许莉莉, 薛莹, 焦燕, 等. 海州湾及邻近海域口虾蛄群体结构及资源分布特征[J]. 中国海洋大学学报, 2017, 47(4): 28-36.] |
| [5] |
Sheng F L, Zeng X Q, Xue Y. Study on propagation and feeding habits of Oratosquilla oratoria in the inshore waters of Qingdao[J]. Periodical of Ocean University of China, 2009, 39(S1): 326-332. [盛福利, 曾晓起, 薛莹. 青岛近海口虾蛄的繁殖及摄食习性研究[J]. 中国海洋大学学报, 2009, 39(S1): 326-332.] |
| [6] |
Ding G, Zhang D Z, Zhang H B, et al. Genetic diversity of Oratosquilla oratoria population in the marine area of Shandong[J]. Jiangsu Agricultural Sciences, 2016, 44(1): 254-256. [丁鸽, 张代臻, 张华彬, 等. 山东海域口虾蛄种群的遗传多样性[J]. 江苏农业科学, 2016, 44(1): 254-256.] |
| [7] |
Liu X Z, Guo D, Wang A Y, et al. The resource characteristics and their variation of Oratosquilla oratoria in Liaodong Bay[J]. Acta Hydrobiologica Sinice, 2014, 38(3): 602-608. [刘修则, 郭栋, 王爱勇, 等. 辽东湾海域口虾蛄的资源特征及变化[J]. 水生生物学报, 2014, 38(3): 602-608.] |
| [8] |
Kim S E, Kim H J, Bae H J, et al. Growth and reproduction of the Japanese mantis shrimp, Oratosquilla oratoria (De Haan 1844) in the coastal area of Tongyeong, Korea[J]. Ocean Science Journal, 2017, 52(2): 257-265. DOI:10.1007/s12601-017-0027-2 |
| [9] |
Ding G, Zhang D Z, Zhang H B, et al. Population genetics of Oratosquilla oratoria in Bohai Sea and Yellow Sea[J]. Sichuan Journal of Zoology, 2015, 34(4): 494-499. [丁鸽, 张代臻, 张华彬, 等. 黄渤海海域口虾蛄野生资源的种群遗传学研究[J]. 四川动物, 2015, 34(4): 494-499.] |
| [10] |
Zhang D Z, Ding G, Zhou T T, et al. Genetic diversity of Oratosquilla oratoria populations in Yellow Sea[J]. Chinese Journal of Zoology, 2013, 48(2): 232-240. [张代臻, 丁鸽, 周婷婷, 等. 黄海海域口虾蛄种群的遗传多样性[J]. 动物学杂志, 2013, 48(2): 232-240.] |
| [11] |
Pan G L, Zhang L, Zhu Z J, et al. Spatial-temporal distribution of the biomass of Oratosquilla oratoria in the coastal waters of south Zhejiang during spring[J]. Oceanologia et Limnologia Sinica, 2013, 44(2): 366-770. [潘国良, 张龙, 朱增军, 等. 浙江南部近岸海域春季口虾蛄生物量的时空分布[J]. 海洋与湖沼, 2013, 44(2): 366-370.] |
| [12] |
Li T, Zhang X M, Zhang P D, et al. Seasonal variation on community structure of fishery resources in the coastal waters of southern Shandong Peninsular[J]. Periodical of Ocean University of China, 2011, 41(Z1): 41-50. [李涛, 张秀梅, 张沛东, 等. 山东半岛南部近岸海域渔业资源群落结构的季节变化[J]. 中国海洋大学学报, 2011, 41(Z1): 41-50.] |
| [13] |
Wang B, Zhang X L, Sun P X. On biological characters and artificial seedling-rearing techniques of mantis shrimp (Oratosquilla oratoria)[J]. Journal of Oceanography of Huanghai & Bohai Seas, 1998, 16(2): 64-72. [王波, 张锡烈, 孙丕喜. 口虾蛄的生物学特征及其人工苗种生产技术[J]. 黄渤海海洋, 1998, 16(2): 64-73.] |
| [14] |
Wardiatno Y, Mashar A. Biological information on the mantis shrimp, Harpiosquilla raphidea (Fabricius 1798) (Stomatopoda, Crustacea) in Indonesia with a highlight of its reproductive aspects[J]. Journal of Tropical Biology and Conservation, 2010, 7: 65-73. |
| [15] |
Liu H Y, Gu D X, JiangY S, et al. Annual reproductive cycle and germ cell development in mantis shrimp Oratosquilla oratoria[J]. Journal of Dalian Ocean University, 2013, 28(3): 269-272. [刘海映, 谷德贤, 姜玉声, 等. 口虾蛄繁殖周期及生殖细胞发育的研究[J]. 大连海洋大学学报, 2013, 28(3): 269-272. DOI:10.3969/j.issn.2095-1388.2013.03.010] |
| [16] |
Sheng F L. Study on the fishery biology of Oratosquilla oratoria in the coastal waters of Qingdao offshore[D]. Qingdao: Ocean University of China, 2009. [盛福利.青岛近海口虾蛄渔业生物学的初步研究[D].青岛: 中国海洋大学, 2009.]
|
| [17] |
Wang C L, Yin F, Wang W. Influence of nutrition-intensified Artemia nauplii on digestive enzyme activities and anti-stress in larval Oratosquilla kempi[J]. Journal of Fisheries of China, 2007, 31(6): 778-784. [王春琳, 尹飞, 王武. 饵料卤虫的营养强化对黑斑口虾蛄幼体消化酶活力及其抗逆性的影响[J]. 水产学报, 2007, 31(6): 778-784.] |
| [18] |
State Oceanic Administration. Specifications for oceanographic survey part VI: Marine biological survey, GB/T 12763.6-2007[S]. Beijing: Standards Press of China, 2007. [国家海洋局.海洋调查规范第六部分: 海洋生物调查, GB/T 12763.6-2007[S].北京: 中国标准出版社, 2007.]
|
| [19] |
Pauly D, David N. A basic program for the objective extraction of growth parameters from length-frequency data[J]. Reports on Marine Research, 1981, 28(4): 205-211. |
| [20] |
Pauly D, Gaschutz G. A simple method for fitting oscillating length growth data, with a program for pocket calculators[R]. ICES Demersal Fish Committee Council Meeting. 1979/G: 24.
|
| [21] |
Li Z. The study on the performances of length-frequency analysis methods on the simulated and real fishery data sets[D]. Qingdao: Ocean University of China, 2006. [李壮.渔业体长频数分析法在模拟和实际渔业中的应用[D].青岛: 中国海洋大学, 2006.]
|
| [22] |
Mildenberger T K, Taylor M H, Wolff M. TropFishR: an R package for fisheries analysis with length-frequency data[J]. Methods in Ecology and Evolution, 2017, 8(11): 1520-1527. DOI:10.1111/2041-210X.12791 |
| [23] |
Ye T, Wang Y B, Zhou C Y, et al. Analysis of effects of fish length frequency data on estimates of growth parameters[J]. Fisheries Science, 2014, 33(5): 277-282. [叶婷, 王迎宾, 周从羽. 鱼类体长频率数据结构对生长参数估算的影响分析[J]. 水产科学, 2014, 33(5): 277-282. DOI:10.3969/j.issn.1003-1111.2014.05.003] |
| [24] |
Xu S N, Wang Z H, Liang J L, et al. Use of different sampling tools for comparison of fish-aggregating effects along horizontal transect at two artificial reef sites in Shengsi[J]. Journal of Fisheries of China, 2016, 40(5): 820-831. [徐胜南, 汪振华, 梁金玲, 等. 不同网具在人工鱼礁水平上诱集效果的比较[J]. 水产学报, 2016, 40(5): 820-831.] |
| [25] |
Zhao J, Zhang S Y, Zhou X J, et al. Comparative analysis of two sampling gillnets of rocky reef area in Gouqi Islands, Shengsi, Zhejiang[J]. Journal of Fisheries of China, 2013, 37(2): 311-320. [赵静, 章守宇, 周曦杰, 等. 浙江嵊泗枸杞岛岩礁生境中两种刺网采样网具的比较[J]. 水产学报, 2013, 37(2): 311-320.] |
| [26] |
Chen Y Y, Tang Y. On improving statistical system of marine fisheries in China[J]. Marine Fisheries, 2012, 34(4): 476-481. [陈园园, 唐议. 关于改善我国海洋渔业统计制度的建议[J]. 海洋渔业, 2012, 34(4): 476-481. DOI:10.3969/j.issn.1004-2490.2012.04.016] |
| [27] |
Liu Y, Chen Y, Cheng J H. A comparative study of optimization methods and conventional methods for sampling design in fishery-independent surveys[J]. ICES Journal of Marine Science, 2009, 66(9): 1873-1882. DOI:10.1093/icesjms/fsp157 |
| [28] |
Gunderson D R. Surveys of Fisheries Resources[M]. New York: John Wiley & Sons Inc, 1993.
|
| [29] |
Chen B G, Li Y Z, Chen P M, et al. Optimum interval class size of length-frequency analysis of fish[J]. Journal of Fishery Sciences of China, 2018, 15(4): 659-666. [陈宝国, 李永振, 陈丕茂, 等. 鱼类最佳体长频率分析组距研究[J]. 中国水产科学, 2018, 15(4): 659-666.] |
| [30] |
Dai L B, Tian S Q, Liu W C, et al. Comparison of the relation between the length frequency distribution and sample size for several commercial fish species in the Wentai fishing ground[J/OL]. Journal of Fisheries of China, 2018: 1-12.[2019-03-19]. http://kns.cnki.net/kcms/detail/31.1283.S.20180504. 1435.006.html. [戴黎斌, 田思泉, 刘伟成, 等.温台渔场3种经济鱼类体长频次分布与采样量间关系的比较[J/OL].水产学报, 2018: 1-12.[2019-03-19]. http://kns.cnki.net/kcms/ detail/31.1283.S.20180504.1435.006.html.]
|
| [31] |
Guan W J, Zhu J F, Gao F. Analysis of influencing factors on stock assessment of the Indian Ocean albacore tuna (Thunnus alalunga)[J]. Journal of Fishery Sciences of China, 2018, 25(5): 1102-1114. [官文江, 朱江峰, 高峰. 印度洋长鳍金枪鱼资源评估的影响因素分析[J]. 中国水产科学, 2018, 25(5): 1102-1114.] |
 2019, Vol. 26

