2. 青岛海洋科学与技术试点国家实验室, 海洋渔业科学与食物产出过程功能实验室, 山东 青岛 266071
2. Laboratory for Marine Fisheries Science and Food Production Processes, Pilot National Laboratory for Marine Science and Technology(Qingdao), Qingdao 266071, China
黄海是位于大陆架之上的一个半封闭边缘海, 平均水深仅为44 m, 通常以山东半岛成山角至朝鲜半岛长山一线为界, 分为北黄海和南黄海两个地理区, 黄海槽自济州岛经南黄海延伸至北黄海[1]。黄海冷水团、长江冲淡水、鸭绿江径流等水文物理过程, 给黄海生态系统的生物生产和食物网动力学带来影响。浮游植物是链接海洋生态系统高营养层次的基础环节, 近几十年来, 在人类活动和区域气候变化的双重压力下, 浮游植物群落结构出现了明显的年代际演变和长期变化特征[2]。黄海有着众多硬骨鱼类的产卵场和育幼场[3], 浮游植物时空分布的变动和群落演替, 势必通过营养级联效应影响到鱼类早期阶段的摄食和存活, 进而对重要渔业生物关键栖息地水域的种群补充和资源量构成威胁。
黄海浮游植物的研究可追溯到1985—2000年50年代[4], 早期的研究集中在形态分类和生态分布方面, 其后研究内容逐渐涉及基础生产力、群落和功能群、水华过程及环境控制等[5-8], 这些工作对深入认识黄海浮游植物的生态特征及其在生态系统中的作用提供了很好的研究积淀。然而历史资料的调查在研究目的、区域、方法和内容方面皆存在一定的差异, 在时空尺度上亦较为零星和分散, 对黄海浮游植物的长期演变趋势和年代际变动特征的相关报道较少。因此, 本研究旨在通过对自1985—2000年80年代以来开展的黄海网采浮游植物大面调查历史资料的分析, 研究黄海浮游植物群落结构的年代际变动和演变特征, 为进一步从浮游饵料基础变动的角度, 解析黄海重要渔业生物关键栖息地种群早期补充和食物网过程的影响因素提供数据资料和科学依据。
1 材料与方法 1.1 样品采集与分析浮游植物年代际样品来源于中国水产科学研究院黄海水产研究所在1985—2015年开展的黄海渔业资源和生态环境大面综合调查。在黄海海域共计采集了1125份浮游植物网样, 其中北黄海样品220份, 南黄海样品905份(表 1)。于各站位使用浅水Ⅲ型浮游生物网(网口面积0.1 m2, 筛孔对角线长77 μm)自底至表进行垂直拖网, 样品转移至1 L的聚乙烯瓶中, 加入甲醛水溶液至样品终浓度为5%, 常温避光保存。
|
|
表 1 黄海浮游植物年代际网采样品信息 Tab.1 Baseline information on interdecadal net-tow samplings of phytoplankton in the Yellow Sea |
浮游植物群落分析于实验室内进行, 样品根据浮游植物的多少进行稀释或浓缩, 取0.5 mL的亚样品置于朱树屏计数框(类似Sedgwick-Rafter计数框), 然后在光学显微镜(Leica Biomed)下进行物种鉴定与丰度统计, 物种分类参考已有标准[4, 9-10]。
1.2 数据处理浮游植物群落的物种丰富度、多样性、均匀度和优势度分别采用Margalef指数、Shannon- Weaver指数、Pielou指数和Dufrene-Legendre指数进行计算, 具体公式参考文献[11]。浮游植物群落组成的差异贡献率采用SIMPER分析进行, 利用PAST 3.18软件实现。
2 结果与分析 2.1 物种组成的年代际变化年代际样品共鉴定浮游植物202种(含变种、变型), 其中硅藻58属142种, 甲藻20属57种, 硅鞭藻2属2种, 裸藻1种。硅藻类群记录较多的属种有角毛藻(Chaetoceros) 35种、圆筛藻(Coscinodiscus)14种、根管藻(Rhizosolenia)8种和海链藻(Thalassiosira)7种。甲藻类群记录较多的有原多甲藻(Protoperidinium)15种和角藻(Tripos, 为Ceratium的同物异名)10种。从物种数比例来看, 在1980s、1990s、2000s和2010s 4个年代际的季节调查发现,硅藻平均分别占到了62.4%、69.1%、74.4%和62.6%, 甲藻占到了37.6%、30.9%、25.1%和36.6%, 硅藻、甲藻物种数比例在年代际之间变化并不大。但是从夏季来看, 硅藻物种数比例年代际平均仅为47.5%, 甲藻则为52.3%。
从优势种构成来看(表 2), 4个年代际平均优势度大于0.02的浮游植物有19(硅藻15、甲藻4)属种。硅藻中的星脐圆筛藻(C. asteromphalus)、辐射圆筛藻(C. radiatus)、舟形藻(Navicula)、具槽帕拉藻(Paralia sulcata)、印度鼻状藻(Proboscia indica)、刚毛根管藻(R. setigera)、中肋骨条藻(Skeletonema costatum)以及甲藻中的梭形角藻(T. fusus)、牟氏角藻(T. muelleri)的平均优势度都大于0.05, 是黄海浮游植物群落常见优势种。从优势种的年代际转换来看, 具槽帕拉藻、梭形角藻和牟氏角藻在各年代际皆能形成优势, 但是其优势度自进入2005—2015年以来, 分别增加了7.1倍、5.4倍和4.2倍。对1985—2000年和2005—2015年进行比较后发现, 硅藻中的角毛藻、圆筛藻、具槽帕拉藻、根管藻和甲藻中的角藻等属种在黄海浮游植物群落中能够保持优势地位。不同的是, 进入2005—2015年后, 广温性的中肋骨条藻、菱形海线藻(Thalassionema nitzschioides), 暖温性的萎软几内亚藻(Guinardia flaccida), 以及暖水性的洛氏角毛藻(C. lorenzianus)、距端假管藻(Pseudosolenia calcar-avis)等物种开始在群落中成为优势种, 且优势度皆高达0.05以上。从优势种的生态类型来看, 广温种比例变化不大, 在1985—2000年和2005—2015年平均分别为67.4%和71.8%, 暖水种比例在2005—2015年上升到平均10.3%。
|
|
表 2 黄海浮游植物优势种组成的年代际变化 Tab.2 Interdecadal changes on dominant phytoplankton composition in the Yellow Sea |
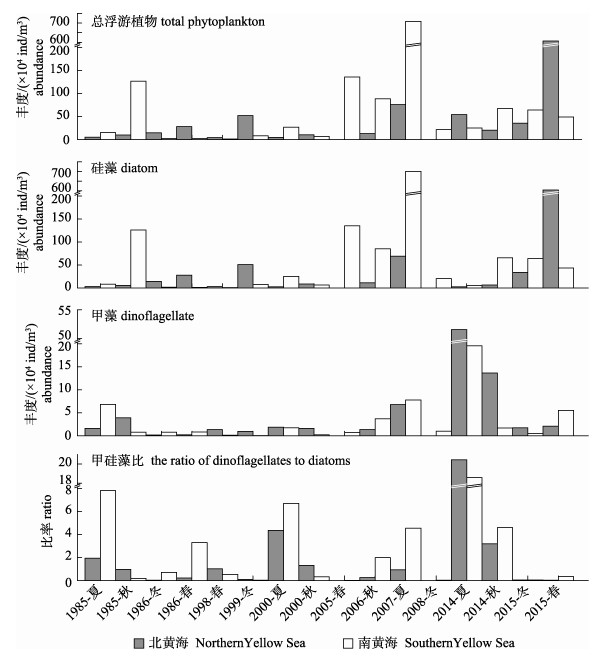
黄海浮游植物总丰度年代际变动在1.26×10⁴~ 709×104个/m3, 平均76.2×10⁴个/m3。硅藻丰度年代际变动在1.1×104~701×104个/m3, 平均71.5× 10⁴个/m3, 其平均占到了总丰度的80.3%, 在2010s仅平均占到67.5%。甲藻丰度年代际变动在0.084×10⁴~51.6×10⁴个/m3, 平均4.72×10⁴个/m3, 其平均占到了总丰度的19.7%, 在2010s平均占到32.5%。黄海浮游植物总丰度、硅藻丰度和甲藻丰度在2005—2015年的平均水平为140×104个/m3、132×104个/m3和8.4×104个/m3, 分别较1985—2000年增加了6.0倍、6.1倍和4.7倍, 其中北黄海平均为134×104个/m3、121×104个/m3和12.9×104个/m3, 分别增加了7.3倍、7.2倍和7.6倍, 南黄海平均为145×104个/m3、140×104个/m3和5.1×104个/m3, 分别增加了5.1倍、5.3倍和2.5倍。从甲藻、硅藻的丰度比来看(图 1), 黄海甲硅藻比年代际变动在0.012~20.400, 其在2005—2015年的平均水平为3.93, 较1985—2000年平均水平增加了1.13倍, 其中北黄海和南黄海分别为4.15和3.77, 分别增加了2.33倍和53.7%。黄海甲硅藻比具明显的季节性, 夏季平均水平为8.17, 是其他季节平均水平的7.29倍。

|
图 1 黄海浮游植物丰度的年代际变化 Fig.1 Interdecadal changes on phytoplankton abundances in the Yellow Sea |
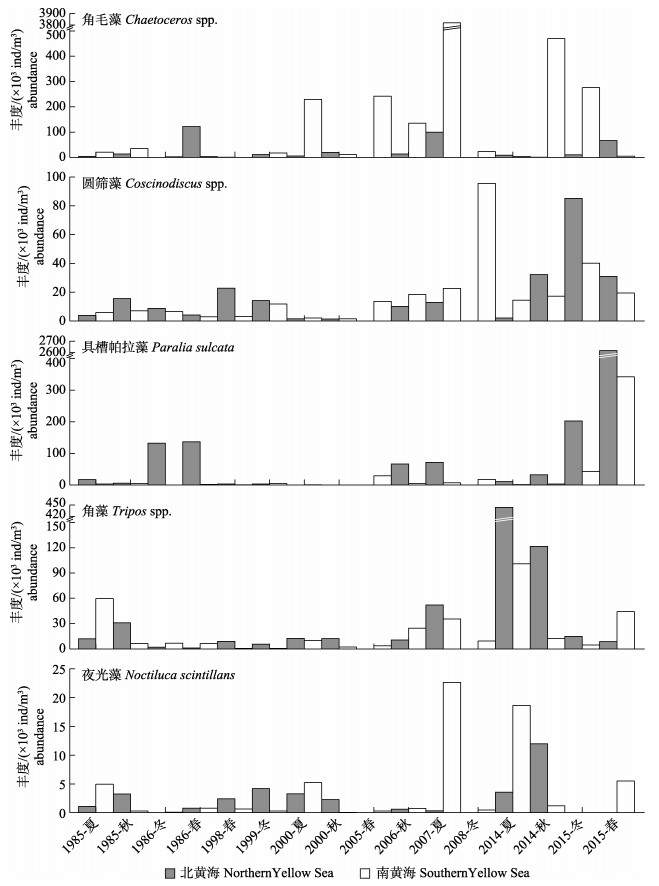
从黄海浮游植物群落优势种的年代际变动来看, 硅藻、甲藻类群的主要优势种丰度在2005—2015年都呈现出上升的趋势(图 2)。30年来, 黄海角毛藻丰度平均水平为189×103个/m3, 在2005—2015年的平均水平为369×103个/m3, 较1985—2000年增加了11倍, 其中北、南黄海平均为33.1×10³个/m3和621×103个/m3, 分别增加了51.7%和14.6倍。圆筛藻丰度平均水平为17.5×10³个/m3, 在2005—2015年的平均水平为29.6×10³个/m3, 较1985—2000年增加了3.24倍, 其中北、南黄海平均为28.9×10³个/m3和30.2×103个/m3, 分别增加了2.22倍和5倍。具槽帕拉藻丰度平均水平为126×103个/m3, 在2005—2015年的平均水平为246×103个/m3, 较1985—2000年增加了11.5倍, 其中北、南黄海平均为500×103个/m3和56.1×103个/m3, 分别增加了12.4倍和25.8倍。角藻丰度平均水平为35.4×10³个/m3, 在2005—2015年的平均水平为63.3×10³个/m3, 较1985—2000年增加了4.7倍, 其中北、南黄海平均为108×103个/m3和29.4×103个/m3, 分别增加了9.19倍和1.55倍。夜光藻(Noctiluca scintillans)丰度平均水平为3.19×10³个/m3, 在2005—2015年的平均水平为4.71×10³个/m3, 较1985—2000年增加了1.54倍, 其中北黄海平均为2.75×10³个/m3, 南黄海平均为6.19×10³个/m3, 分别增加了26.9%和3倍。

|
图 2 黄海浮游植物优势种丰度的年代际变化 Fig.2 Interdecadal changes on phytoplankton abundances of dominant taxa in the Yellow Sea |
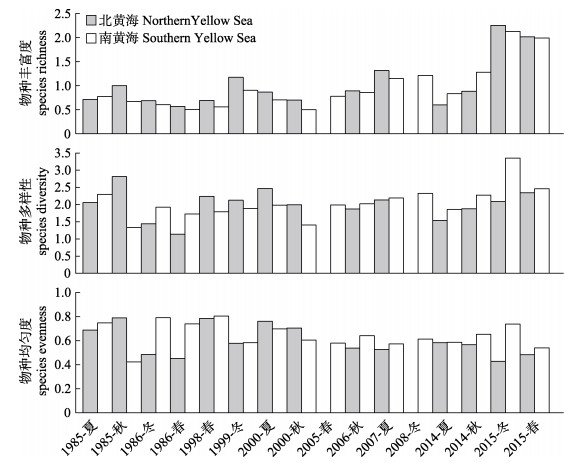
从黄海浮游植物多样性的长期变化来看(图 3), 物种丰富度在0.5~2.25之间变动, 平均0.99, 在2005—2015年的平均水平为1.3, 较1985—2000年增加了78.9%, 其中北、南黄海平均为1.33和1.28, 分别增加了65.9%和95.9%。物种多样性在1.14~3.35之间变动, 平均2.03, 在2005—2015年的平均水平为2.17, 较1985—2000年增加了13.3%, 其中北、南黄海平均为1.98和2.31, 分别降低了2.85%和增加了28.9%。物种均匀度在0.42~0.8之间变动, 平均0.62, 在2005—2015年的平均水平为2.17, 较1985—2000年降低了13.5%, 其中北、南黄海平均为0.52和0.62, 分别降低了20.6%和8.67%。

|
图 3 黄海浮游植物多样性的年代际变化 Fig.3 Interdecadal changes on phytoplankton diversities in the Yellow Sea |
对黄海浮游植物2005—2015年和1985—2000年的群落差异性进行了SIMPER分析(表 3), 结果显示仅17属种浮游植物对群落差异的累计贡献率就已达90%以上, 在黄海、北黄海和南黄海分别有15、12和16属种。从整个黄海来看, 角藻对群落差异的贡献率最大(高达16.69%), 其次为角毛藻、具槽帕拉藻、圆筛藻、鼻状藻、中肋骨条藻等。但是分海区来看情况略有不同, 在北黄海具槽帕拉藻对群落差异的贡献最大(高达30.03%), 其次为角藻(23.17%)以及角毛藻、圆筛藻、原多甲藻等, 此外弯角藻(Eucampia)在北黄海的差异贡献达到了1.819%。在南黄海角毛藻和角藻的差异贡献率分别达到了16.13%和15.53%, 其次为圆筛藻、鼻状藻、具槽帕拉藻、中肋骨条藻等。
|
|
表 3 黄海浮游植物群落在2005—2015年与1985—2000年的差异贡献率 Tab.3 Percentage of contribution on phytoplankton community dissimilarity between 2005-2015 period and 1985-2000 period in the Yellow Sea |
自1985—2000年50年代开展全国海洋综合调查以来, 对黄海浮游植物分类与生态学的研究也逐渐深入。黄海浮游植物具明显的温带海区群落特征, 呈“双峰型”周年变化[5], 丰度高值常出现在春季水华期间[7]。黄海常见浮游植物类群有广温广盐类群如中肋骨条藻、菱形海线藻等, 近岸低盐类群如夜光藻等, 适温较高类群如角藻、圆筛藻等, 适温较低类群如拟星杆藻(Asterionellopsis)等, 此外还包括暖水性类群如距端假管藻、洛氏角毛藻等[5]。群落优势种主要由角毛藻、圆筛藻、具槽帕拉藻、根管藻、角藻等硅藻、甲藻类群构成[12]。本研究中, 自1985年以来的年代际浮游植物样品分析结果在群落优势种组成及其生态类型方面与历史研究皆有很好的一致性。在大陆径流(长江、鸭绿江等)、冷水团、环流、暖流等诸多水动力因素的影响下, 黄海浮游植物群落结构的时空特征始终处于动态变化之中, 黄海浮游植物主要受到P营养盐的限制, 北、南黄海分别在夏季和秋季最为明显[13], 但是在黄海近岸水域如胶州湾, 营养盐结构则出现了由N限制到P限制再到Si限制的长期变化趋势[14], 这也直接导致了浮游植物甲藻类数量升高, 分布范围扩大[15]。
黄海作为西北太平洋的陆架边缘海, 在人类活动和区域气候变化的共同影响下, 浮游植物群落已出现了明显的长期变化趋势与年代际演变特征。从南黄海来看, 研究表明近年来角毛藻、角藻、夜光藻、拟菱形藻(Pseudo-nitzschia)成为群落优势种, 硅藻在群落中的丰度比例下降到50%~ 60%[16], 本研究亦发现进入2005—2015年以来南黄海角毛藻丰度平均水平较之前有了大幅增加, 角藻、夜光藻等甲藻的丰度平均水平也显著提升, 导致硅藻丰度比例在2010s下降至76.9%。近年来的文献也记录了南黄海夜光藻等近岸低盐类群丰度水平出现增加的趋势[17]。北黄海浮游植物群落的年代际转换格局与南黄海不同, 2005—2015年以来, 具槽帕拉藻丰度平均水平有了大幅升高, 其次是角藻、原多甲藻等甲藻类群, 这与近年来北黄海浮游植物群落调查结果也较为一致[18], 具槽帕拉藻、牟氏角藻、梭形角藻等物种在群落中具明显的优势地位。浮游植物多样性指数可以用来反映群落的稳定性程度, 从黄海浮游植物多样性的年代际变动来看, 北、南黄海的物种丰富度指数进入2005—2015年后有了较大程度的提升, 这一趋势在南黄海资料[19]中已有体现, 自2007年以来南黄海浮游植物种类数呈明显上升趋势。由于浮游植物群落结构发生了年代际的演替和格局转换, 物种多样性和均匀度指数随之出现了一定的变动, 因此群落的稳定性和均匀程度亦受到不同程度的影响。本研究发现南黄海物种多样性指数出现了上升, 这对群落稳定性程度有积极影响, 然而北黄海变动却不大, 表明北黄海浮游植物群落长期来看相对稳定, 这与已有文献[18]得出的近30年来北黄海浮游植物群落结构比较稳定的观点相一致。
3.2 黄海浮游植物群落演变对渔业生物饵料基础的影响浮游植物作为海洋生态系统主要的初级生产者, 其种类组成、丰度和基础生产力水平的变化将通过食物网直接影响到整个生态系统的结构和产出。黄海有众多中上层鱼类、底层鱼类的产卵场和索饵场, 北黄海集中在烟威近岸、鸭绿江至海洋岛等水域, 南黄海集中在山东南部近岸、海州湾及江苏近岸等水域[20]。因此, 浮游植物群落的长期演变及其完整性、稳定性的变动, 直接影响到黄海渔业生物饵料基础的构成及其水平。
研究表明海洋鱼类在不同的生长发育阶段, 对饵料生物的选择性是不同的。真鲷(Pagrosomus major)、秘鲁鳀(Engraulis ringens)等在其仔鱼阶段能够摄食浮游植物[21], 成体秘鲁鳀胃含物食物组成研究发现浮游植物有61属(其中硅藻38属、甲藻16属), 圆筛藻和海链藻分别占到54%和14.6%, 此外还有双尾藻(Ditylum)、原多甲藻等[22]。但是对于日本鳀(E. japonicus), 在其仔稚鱼期主要以桡足类幼体、卵、砂壳纤毛虫等饵料为主, 转入幼鱼期后, 随着鳃耙数目的增加, 浮游植物成为此时的主要饵料, 包括原多甲藻、梭形角藻和牟氏角藻等[23]。黄海北部鳀幼鱼至成鱼, 圆筛藻和具槽帕拉藻都是其主要饵料[24]。远东拟沙丁鱼(Sardinops melanostictus)可以摄食多达28种浮游植物, 主要为圆筛藻、海链藻、三桨舰藻(Trieres, 为Odontella的同物异名)、舟形藻等硅藻类群, 也有牟氏角藻、鳍藻(Dinophysis)等甲藻出现, 而且摄食的种类数量随叉长的增加而逐渐增多[25]。斑鰶(Clupanodon punctatus)摄食的浮游植物主要包括舟形藻、菱形藻(Nitzschia)、中肋骨条藻、圆筛藻、根管藻等浮游和底栖硅藻类, 另外亦摄食浮游动物、碎屑和腐殖质等[26]。中国明对虾(Fenneropenaeus chinensis)仔虾食物主要以舟形藻、斜纹藻(Pleurosigma)、圆筛藻等硅藻类浮游植物为主, 幼体主要以原多甲藻为食, 至成体阶段则转变为以底栖甲壳类、贝类和多毛类为主要食物来源的混合食性[27]。由此可见, 尽管鱼类、对虾等在其生活史的不同阶段存在食性的转变, 但是浮游植物在其特定的生长时期是重要的基础饵料。浮游植物丰度水平、水华时机与产卵、育幼时节是否匹配, 浮游植物优势种的粒径大小在仔期初次开口摄食阶段是否一致、适口, 都会直接影响渔业生物早期群体的资源补充。
黄海浮游植物群落的长期演变决定了渔业水域饵料基础的变动, 而饵料基础的变动又会通过食物网营养级联效应影响到渔业资源的结构。已有研究表明北黄海及山东半岛南部近岸海域的渔业资源群落结构已经出现了衰退现象, 渔获物以小型低值鱼类(日本鳀、赤鼻棱鳀等)、无脊椎动物(脊腹褐虾等)经济幼鱼(小黄鱼)为主, 渔获个体偏小[28]。这种渔业资源结构的改变与人类活动(如捕捞压力等)、环境变化(如气候变化、污染物等)、饵料基础变动等因素皆密切相关[29]。本研究从饵料基础分析发现, 尽管黄海浮游植物的物种组成长期来看出现了一定的演替, 但是新的优势类群仍为黄海生态系统关键渔业生物不同生长阶段的重要饵料, 比如具槽帕拉藻、圆筛藻、角藻、原多甲藻等。尽管浮游植物总丰度存在季节、年代际的变动, 但是其主要饵料种丰度水平能够保持并且出现渐增的长期变化趋势。此外, 黄海甲藻丰度水平及其优势地位显著提升, 特别是角藻、原多甲藻等属种成为新优势种, 这种饵料丰度和结构的改变或许能对渔业生物的早期摄食和重要渔业种群的资源补充带来积极影响。浮游植物饵料基础的变动与生态系统食物网结构和渔业生物早期补充之间存在复杂的营养级联机制, 因此还需要更多的基础调查工作和学科交叉研究来补充和完善。
致谢: 感谢天津渤海水产研究所张雪在2014年夏季、秋季黄海样品分析中给予的帮助。| [1] |
Feng S Z, Li F Q, Li S J. Introduction on Marine Science[M]. Beijing: Higher Education Press, 1999. [冯士筰, 李凤歧, 李少菁. 海洋科学导论[M]. 北京: 高等教育出版社, 1999.]
|
| [2] |
Luan Q S, Kang Y D, Wang J. Long-term changes in the phytoplankton community in the Bohai Sea (1959-2015)[J]. Progress in Fishery Sciences, 2018, 39(4): 9-18. [栾青杉, 康元德, 王俊. 渤海浮游植物群落的长期变化(1959~2015)[J]. 渔业科学进展, 2018, 39(4): 9-18.] |
| [3] |
Wan R J, Jiang Y W. Studies on the ecology of eggs and larvae of Osteichthyes in the Yellow Sea[J]. Marine Fisheries Research, 1998, 19(1): 60-73. [万瑞景, 姜言伟. 黄海硬骨鱼类鱼卵、仔稚鱼及其生态调查研究[J]. 海洋水产研究, 1998, 19(1): 60-73.] |
| [4] |
Zhu S P, Guo Y J. Studies on the genus Chaetoceros Ehrenberg from the fishing ground of the mackerel, Pneumatophorus japonicus (Houttuyn), off the Shantung coast from Chefoo to Weihai. Part Ⅰ. A systematic study[J]. Oceanologia et Limnologia Sinica, 1957, 1(1): 27-87. [朱树屏, 郭玉洁. 烟台、威海鲐鱼渔场及其附近海区角毛硅藻属的研究Ⅰ.分类的研究[J]. 海洋与湖沼, 1957, 1(1): 27-87.] |
| [5] |
Yu J L, Li R X. The study on the phytoplankton ecology in the Bohai and Yellow Seas[J]. Journal of Oceanography of Huanghai & Bohai Seas, 1993, 11(3): 52-59. [俞建銮, 李瑞香. 渤海、黄海浮游植物生态的研究[J]. 黄渤海海洋, 1993, 11(3): 52-59.] |
| [6] |
Zhu M Y, Mao X H, Lü R H, et al. Chlorophyll a and primary productivity in the Yellow Sea[J]. Journal of Oceanography of Huanghai & Bohai Seas, 1993, 11(3): 38-51. [朱明远, 毛兴华, 吕瑞华, 等. 黄海海区的叶绿素a和初级生产力[J]. 黄渤海海洋, 1993, 11(3): 38-51.] |
| [7] |
Tian W, Sun J. Later spring phytoplankton community in Southern Yellow Sea in 2009[J]. Marine Sciences, 2011, 35(6): 19-24. [田伟, 孙军. 2009年晚春黄海南部浮游植物群落[J]. 海洋科学, 2011, 35(6): 19-24.] |
| [8] |
Fu M Z, Sun P, Wang Z L, et al. Seasonal variations of phytoplankton community size structures in the Huanghai (Yellow) Sea cold water mass area[J]. Acta Oceanologica Sinica, 2010, 32(1): 120-129. [傅明珠, 孙萍, 王宗灵, 等. 黄海冷水团水域浮游植物群落粒级结构的季节变化[J]. 海洋学报(中文版), 2010, 32(1): 120-129.] |
| [9] |
Jin D X, Chen J H, Huang K G. Planktonic Diatoms in China Seas[M]. Shanghai: Shanghai Scientific & Technical Publishers, 1965: 1-230. [金德祥, 陈金环, 黄凯歌. 中国海洋浮游硅藻类[M]. 上海: 上海科学技术出版社, 1965: 1-230.]
|
| [10] |
Tomas C R. Identifying Marine Phytoplankton[M]. San Diego: Academic Press, 1997.
|
| [11] |
Zhang X, Luan Q S, Sun J Q, et al. Annual variation in phytoplankton community and its relationship with ambient environmental factors in adjacent waters of Zhangzi Island[J]. Journal of Dalian Ocean University, 2016, 31(3): 315-323. [张雪, 栾青杉, 孙坚强, 等. 獐子岛海域浮游植物群落周年变化及其与环境因子的关系[J]. 大连海洋大学学报, 2016, 31(3): 315-323.] |
| [12] |
Lü M X, Luan Q S, Peng L, et al. Assemblages of phytoplankton in the Yellow Sea in response to the physical processes during the summer of 2014[J]. Advances in Marine Science, 2016, 34(1): 70-84. [吕末晓, 栾青杉, 彭亮, 等. 2014年夏黄海浮游植物群集及其对物理过程的响应[J]. 海洋科学进展, 2016, 34(1): 70-84.] |
| [13] |
Xie L P, Sun X, Wang B D, et al. Temporal and spatial distributions of nutrient structure and potential nutrient limitation in the Bohai Sea and the Yellow Sea[J]. Marine Sciences, 2012, 36(9): 45-53. [谢琳萍, 孙霞, 王保栋, 等. 渤黄海营养盐结构及其潜在限制作用的时空分布[J]. 海洋科学, 2012, 36(9): 45-53.] |
| [14] |
Shen Z L. Long-term changes in nutrient structure and its influences on ecology and environment in Jiaozhou Bay[J]. Oceanologia et Limnologia Sinica, 2002, 33(3): 322-331. [沈志良. 胶州湾营养盐结构的长期变化及其对生态环境的影响[J]. 海洋与湖沼, 2002, 33(3): 322-331.] |
| [15] |
Sun X X, Sun S, Wu Y L, et al. Long-term changes of phytoplankton community structure in the Jiaozhou Bay[J]. Oceanologia et Limnologia Sinica, 2011, 42(5): 639-646. [孙晓霞, 孙松, 吴玉霖, 等. 胶州湾网采浮游植物群落结构的长期变化[J]. 海洋与湖沼, 2011, 42(5): 639-646.] |
| [16] |
Yang Y, Sun X X, Zheng S, et al. Distribution and long-term variation of net phytoplankton in South Yellow Sea in early summer[J]. Oceanologia et Limnologia Sinica, 2016, 47(4): 755-763. [杨洋, 孙晓霞, 郑珊, 等. 南黄海夏初网采浮游植物分布与长期变化[J]. 海洋与湖沼, 2016, 47(4): 755-763.] |
| [17] |
Qiao R, Luan Q S, Wang J, et al. Distribution and controlling environmental factors of phytoplankton communities in the Laoshan Bay during spring in 2013[J]. Marine Sciences, 2015, 39(7): 13-21. [乔芮, 栾青杉, 王俊, 等. 2013年春季崂山湾浮游植物群落及其环境控制[J]. 海洋科学, 2015, 39(7): 13-21.] |
| [18] |
Guo S J, Sun J, Zhang H, et al. Phytoplankton communities in the Northern Yellow Sea in autumn 2011[J]. Journal of Tianjin University of Science & Technology, 2013, 28(1): 22-29. [郭术津, 孙军, 张辉, 等. 2011年秋季北黄海浮游植物群落[J]. 天津科技大学学报, 2013, 28(1): 22-29.] |
| [19] |
Huang B, Wei N, Tang J L, et al. Changes of phytoplankton community structure and diversity in the South Yellow Sea during 2007-2017[J]. Environmental Monitoring in China, 2018, 34(6): 137-148. [黄备, 魏娜, 唐静亮, 等. 南黄海2007-2017年浮游植物群落结构及多样性变化[J]. 中国环境监测, 2018, 34(6): 137-148.] |
| [20] |
Atlas of fisheries area in the Huanghai & Bohai Seas (1st release)[J]. China Fisheries, 2002(6): 17-19. [黄渤海区渔业水域图(第一批)[J].中国水产, 2002(6): 17-19.]
|
| [21] |
Zhu C D. Aspects on the first-feeding stage and foods of fish larvae[J]. Acta Hydrobiologica Sinica, 1986, 10(1): 86-95. [朱成德. 仔鱼的开口摄食期及其饵料综述[J]. 水生生物学报, 1986, 10(1): 86-95.] |
| [22] |
Espinoza P, Bertrand A. Revisiting Peruvian anchovy (Engraulis ringens) trophodynamics provides a new vision of the humboldt current system[J]. Progress in Oceanography, 2008, 79: 215-227. |
| [23] |
Meng T X. Studies on the feeding of anchovy (Engraulis japonnicus) post larva in the spawning ground in the Southern waters of Shandong Peninsula[J]. Marine Fisheries Research, 2001, 22(2): 21-25. [孟田湘. 山东半岛南部鳀鱼产卵场鳀鱼仔、稚鱼摄食的研究[J]. 海洋水产研究, 2001, 22(2): 21-25.] |
| [24] |
Chen J K. Studies on the feeding of anchovy (Engraulis japonnicus) in the Northern Yellow Sea[R]//Cruise Report of Liaoning Marine Fisheries Research Institute, 1978, 43: 1-11. [陈介康.黄海北部日本鳀鱼食性的研究[R]//辽宁省海洋水产研究所调查报告, 1978, 43: 1-11.]
|
| [25] |
Qian S Q, Hu Y Z. Studies on the feeding behavior of Sardinops melanostictus in the palegic East China Sea[J]. Marine Fisheries, 1993, 15(4): 151-154. [钱世勤, 胡雅竹. 东海外海远东拟沙丁鱼摄食习性的研究[J]. 海洋渔业, 1993, 15(4): 151-154.] |
| [26] |
Zhao C Y. Marine Fishery Resources of China-China Fishery Resources Survey and Province (6th)[M]. Hangzhou: Zhejiang Scientific & Technical Publishers, 1990. [赵传絪. 中国海洋渔业资源-中国渔业资源调查和区划之六[M]. 杭州: 浙江科学技术出版社, 1990.]
|
| [27] |
Deng J Y, Ye C C, Liu Y C. Prawn and Its Resources Management in the Bohai & Huanghai Seas[M]. Beijing: China Ocean Press, 1990. [邓景耀, 叶昌臣, 刘永昌. 渤黄海的对虾及其资源管理[M]. 北京: 海洋出版社, 1990.]
|
| [28] |
Li T. Preliminary study on community structure of fishery resources in North Yellow Sea and coastal waters of southern Shandong Peninsular[D]. Qingdao: Ocean University of China, 2010. [李涛.北黄海及山东半岛南部近岸海域渔业资源群落结构的初步研究[D].青岛: 中国海洋大学, 2010.] http://cdmd.cnki.com.cn/Article/CDMD-10423-1011027538.htm
|
| [29] |
Luan Q S, Kang Y D, Wang J. Long-term changes of phytoplankton community and diversity in adjoining waters of the Yellow River estuary (1960-2010)[J]. Journal of Fishery Sciences of China, 2017, 24(5): 913-921. [栾青杉, 康元德, 王俊. 黄河口邻近海域浮游植物群落及其多样性的长期变化(1960-2010)[J]. 中国水产科学, 2017, 24(5): 913-921.] |
 2020, Vol. 27

