2. 农业农村部大洋渔业开发重点实验室, 上海 201306;
3. 上海海洋大学国家远洋渔业工程技术研究中心, 上海 201306;
4. 上海海洋大学大洋渔业资源可持续开发教育部重点实验室, 上海 201306;
5. 农业农村部大洋渔业资源环境科学观测实验站, 上海 201306
2. Key Laboratory of Oceanic Fisheries Exploration, Ministry of Agriculture and Rural Affairs, Shanghai 201306, China;
3. National Engineering Research Center for Oceanic Fisheries, Shanghai Ocean University, Shanghai 201306, China;
4. Key Laboratory of Sustainable Exploitation of Oceanic Fisheries Resources, Ministry of Education, Shanghai Ocean University, Shanghai 201306, China;
5. Scientific Observing and Experimental Station of Oceanic Fishery Resources, Ministry of Agriculture and Rural Affairs, Shanghai 201306, China
海洋生态系统中, 受全球气候变化和局部海洋环境改变的驱动, 海洋物种的时空分布、丰度及资源量等均受到不同程度的影响。寻找海洋物种与海洋环境之间的关系, 并建立有效的物种分布预报模式, 有助于渔业资源开发和可持续利用, 同时, 可为未来气候变化背景下资源变动研究提供理论基础, 从而对渔业资源进行有效管理和后续评估, 提高应对气候变化的能力。
柔鱼(Ommastrephes bartramii)是西北太平洋渔业重要的经济种类之一, 主要被中国、日本等国家捕获和利用。1974年日本鱿钓调查船首先对该资源进行开发和利用, 1993年中国利用鱿钓船对西北太平洋柔鱼进行了调查, 并于次年开始了小规模的生产, 之后作业规模不断扩大, 每年的渔获量在3万~11万t不等。柔鱼为短生命周期种类, 通常寿命不超过1年[1]。国内外学者研究表明柔鱼资源年间和季节性波动与海洋环境变动息息相关, 如Chen等[2]采用多元线性回归方程建立了柔鱼资源丰度指数与环境变量的关系, 认为拉尼娜事件导致柔鱼资源补充量减少, 同时使渔场北移; 厄尔尼诺事件有利于柔鱼资源补充, 同时使渔场南移。Igarashi等[3]通过回归分析方法分析柔鱼丰度变化, 认为柔鱼资源丰度年际变化与太平洋年代际涛动高度相关。Chen等[4]采用线性回归模型分析了柔鱼渔场重心的时空分布与黑潮和海洋环境变动之间的关系, 认为黑潮的强度和路径变动导致海表面温度异常(sea surface temperature anomaly, SSTA)的变化, 从而使柔鱼栖息地南北移动。Chen等[5]研究认为柔鱼资源丰度与海洋表面温度(sea surface temperature, SST)与海表面盐度(sea surface salinity, SSS)的有关, 进一步采用主成分分析方法表明SST比SSS更能有效预测柔鱼资源丰度的时空变化。Ichii等[6]采用多元线性回归分析方法认为柔鱼育肥场的叶绿素锋所在位置能够对柔鱼资源丰度作出较好的预测。以往研究中的渔场渔情分析大多都是基于渔业资源丰度数据(如单位捕捞努力量渔获量或作业船数)进行统计分析并建立预测模式[7-9], 使研究的结果局限在渔场区的时空范围内, 而最大熵(maximum entropy, MaxEnt)模型可以从局部的物种实际出现点的经纬度数据和对应的环境变量, 结合计算机随机生成的“不出现点”数据, 模拟整个研究区域目标物种的生境适宜性[10]。因此, 该研究在以往的研究基础上选取多个影响柔鱼分布的海洋环境因子, 并采用MaxEnt模型对柔鱼潜在分布进行模拟, 并通过模型中输出结果对柔鱼潜在栖息地进行评价, 进一步分析影响柔鱼潜在分布的重要环境因子, 为柔鱼资源的可持续利用和科学管理提供参考。
1 材料和方法 1.1 渔业数据柔鱼渔业生产数据来源于上海海洋大学鱿钓技术组, 时间为2011—2015年7—10月, 空间分布范围为35°N~50°N, 150°E~175°E, 为西北太平洋传统作业渔场, 我国在该海域内每年的柔鱼产量占北太平洋柔鱼总产量的80%以上。渔业统计数据包括作业船名、作业日期(年、月和日)、作业位置(经度和纬度)、日产量(单位: t)等。该研究利用2011—2015年7—10月每日渔船作业的经纬度数据, 7—10月渔业样本数量分别为10155、14082、12825和10834, 并将该数据按月输入最大熵模型中进行建模。
1.2 海洋环境数据以往研究表明[11-12], 西北太平洋柔鱼资源时空分布受海洋环境因子的影响, 包括SST、Chl a浓度、海洋表面高度(sea surface height, SSH)、SSS、净初级生产力(net primary productivity, NPP)、混合层深度(mixed layer depth, MLD)、涡流动能(eddy kinetic energy, EKE)等, 因此, 该研究基于以往的研究和可获得的数据选取SST、Chl a浓度、海平面异常(sea level anomaly, SLA)、MLD以及NPP五个环境因子进行综合分析, 其中SST、Chl a浓度数据来源与NOAA CoastWatch ERDDAP数据库(https://coastwatch.pfeg.noaa.gov/erddap/index.html), SLA数据来源于法国国家空间研究中心卫星海洋学存档数据中心(AVISO, https://www.aviso.altimetry.fr/en/data.html), MLD数据来源于美国夏威夷大学国际太平洋研究中心(http://apdrc.soest.hawaii.edu/las/v6/dataset?catitem=0), NPP数据来源于美国俄勒冈州立大学网站(http://www.science.oregonstate.edu/ocean.productivity/index.php)。所有环境数据时间为2011—2015年7— 10月, 时间分辨率为月, 空间范围为35°N~50°N, 140°E~180°E, 空间分辨率为0.5°×0.5°。
1.3 MaxEnt模型应用MaxEnt模型在2004年开始应用于物种分布模型(species distribution model, SDM), 目前已被广泛应用于物种分布研究[12-15]。模型运算使用最新的软件MAXENT3.4.1(http://biodiversityinformatics.amnh.org/open_source/maxent/), 该软件输入层(Samples)中的柔鱼分布数据为捕捞当月各渔船每日渔获所在经纬度(即2011—2015年7—10月各月渔船每日渔获所在经纬度数据, 按月以CSV格式进行存储, 包括物种名、经度、纬度, 去除渔获为0的数据记录)。环境图层(Environmental layers)为捕捞当月SST、MLD、NPP、SLA及Chl a浓度数据(即2011—2015年7—10月各月环境变量取平均值后输入对应捕捞月份的环境图层, 且以ASCII格式进行存储)。在设置中随机将柔鱼样本中70%的出现点设置为训练集, 剩余的30%的出现点作为测试集, 重复运算设定为10次, 以消除随机性, 并去除重复数, 结果以Logistic格式输出, 其余选项默认模型的自动设置。
利用受试者工作特征曲线(receiver operating characteristic curve, ROC)下的面积(area≤under curve, AUC值)大小来评价各月模型的精度[16]。将不同月份的MaxEnt模型模拟的柔鱼出现点概率结果分别导入ArcGIS中进行可视化分析, 将模拟的概率值定义为栖息地适宜性指数(habitat suitability index, HSI), 并进行人工划分, 当HSI > 0.6时, 该海域被认作柔鱼最适宜区, 当0.4 < HSI≤0.6, 该海域被认作柔鱼较适宜区, 当0.2 < HSI≤0.4, 该海域被认作柔鱼一般适宜区, 当0 < HSI≤0.2时, 该海域被认作柔鱼不适宜区。最后采用模型中的刀切法(Jackknife)模块对影响柔鱼潜在分布的重要环境因子进行分析[16]。
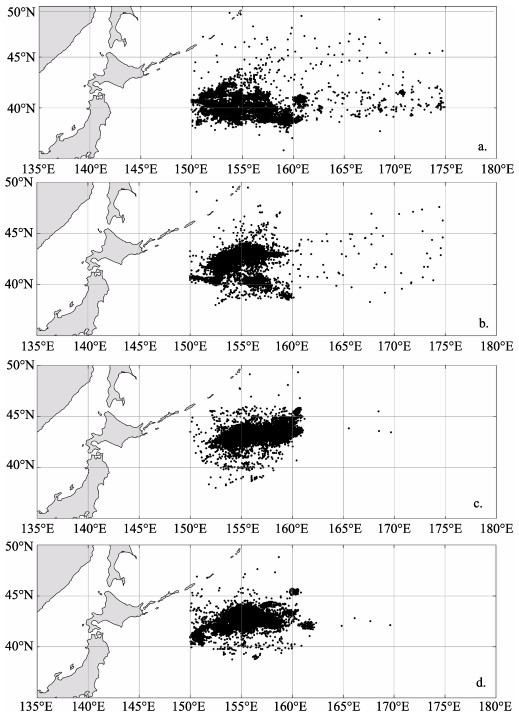
2 结果与分析 2.1 柔鱼渔场时空分布7—10月柔鱼渔场经纬度分布存在季节性差异。渔场经度分布方面, 7—8月柔鱼渔场广泛分布在150°E~175°E之间, 集中分布在150°E~ 160°E之间, 9—10月柔鱼渔场主要分布在150°E~162°E之间, 162°E以东地区几乎没有渔场作业(图 1)。渔场纬度分布方面, 7月柔鱼渔场主要出现在37°N~44°N之间, 8月柔鱼渔场向北移动, 主要出现在40°N~44°N之间, 9月柔鱼渔场向东北移动, 柔鱼渔场主要出现在42°N~46°N, 10月向南移动, 柔鱼渔场主要出现在40°N~44°N之间(图 1)。

|
图 1 2011—2015年7—10月中国鱿钓船各月柔鱼渔场作业分布 a. 7月; b. 8月; c. 9月; d. 10月. Fig.1 Monthly distribution of squid fishing ground for the Chinese squid-jigging vessels from July to October during 2011-2015 a. July; b. August; c. September; d. October. |
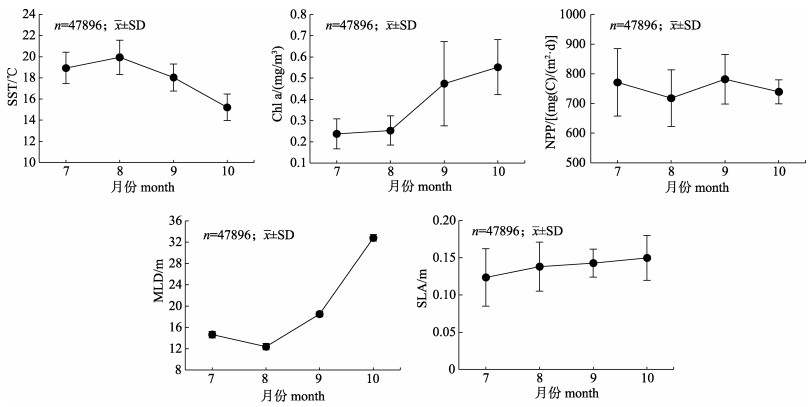
2011—2015年西北太平洋柔鱼渔场各环境因子月变化明显(图 2)。7—10月Chl a浓度和SLA呈逐月递增趋势。7月和8月捕捞月份早期时SST较高, 在随后月份中递减。7—10月NPP呈波动趋势, 7月和9月NPP几乎相等, 8月和10月NPP几乎相等, 且7月和9月NPP明显高于8月和10月NPP。7月和8月捕捞月份早期时MLD偏低, 在随后月份中呈上升趋势, 且上升趋势明显, 9月MLD相比于8月MLD上升了50%, 10月MLD相比于8月MLD上升了160%以上。

|
图 2 2011—2015年7—10月柔鱼渔场海洋环境变化(包括海表面温度、叶绿素a浓度、净初级生产力、混合层深度及海平面异常) Fig.2 Monthly oceanographic environmental changes for squid fishing ground from July to October during 2011-2015, including sea surface temperature (SST), chlorophyll-a (Chl a) concentration, net primary productivity (NPP), mixed layer depth (MLD), and sea level anomaly (SLA) |
ROC曲线分析法是通过计算曲线下方面积, 即AUC值来判断模型模拟的精度。AUC值大小范围为0.5~1, AUC值数值越大, 表明模拟的精度越高, AUC > 0.9时, 表明模拟精度非常高。2011— 2015年各月柔鱼最大熵模型的测试集AUC值均大于0.9 (表 1), 表明MaxEnt模型对西北太平洋柔鱼潜在分布的模拟效果非常好。
|
|
表 1 2011—2015年7—10月柔鱼MaxEnt模型统计结果 Tab.1 Summary statistics derived from monthly models for Ommastrephes bartramii from July to October during 2011-2015 |
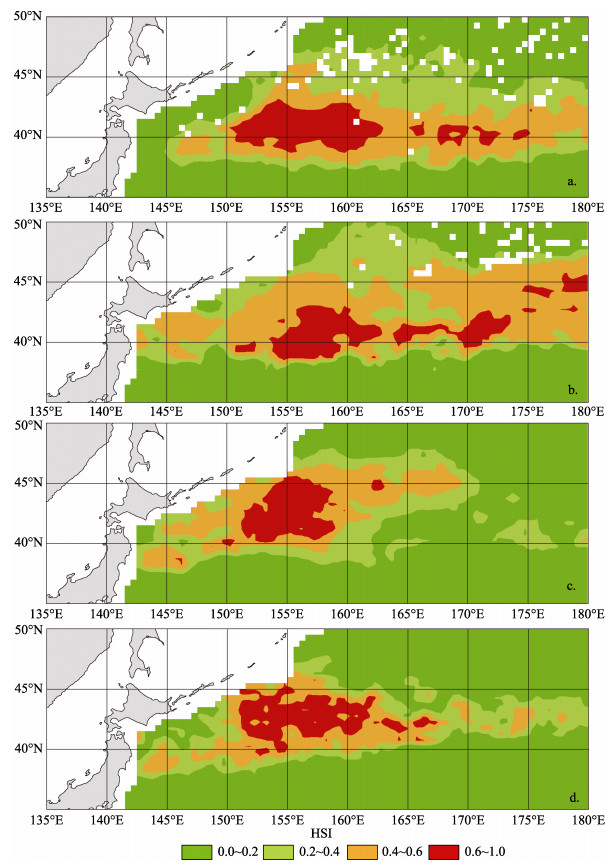
利用MaxEnt模型对西北太平洋柔鱼各月潜在分布的模拟, 结果显示, 2011—2015年7—10月各月柔鱼潜在栖息地分布变化较大(图 3)。7月柔鱼最适宜区主要分布在39°N~43°N, 150°E~ 163°E之间, 最适宜区和较适宜区广泛分布在38°N~ 44°N, 150°E~180°E之间, 呈长条状分布。8月柔鱼最适宜区向东移动, 较适宜区向北扩张至46°N。9月柔鱼最适宜区和较适宜区面积向西急剧缩小, 主要集中在40°N~46°N, 150°E~160°E之间。10月最适宜区和较适宜区向南移动, 主要分布在40°N~45°N, 150°E~165°E之间。

|
图 3 2011—2015年7—10月柔鱼潜在栖息地适宜性指数分布图 a. 7月; b. 8月; c. 9月; d. 10月. Fig.3 The potential habitat suitability index (HSI) distribution of Ommastrephes bartramii from July to October during 2011-2015 a. July; b. August; c. September; d. October. |
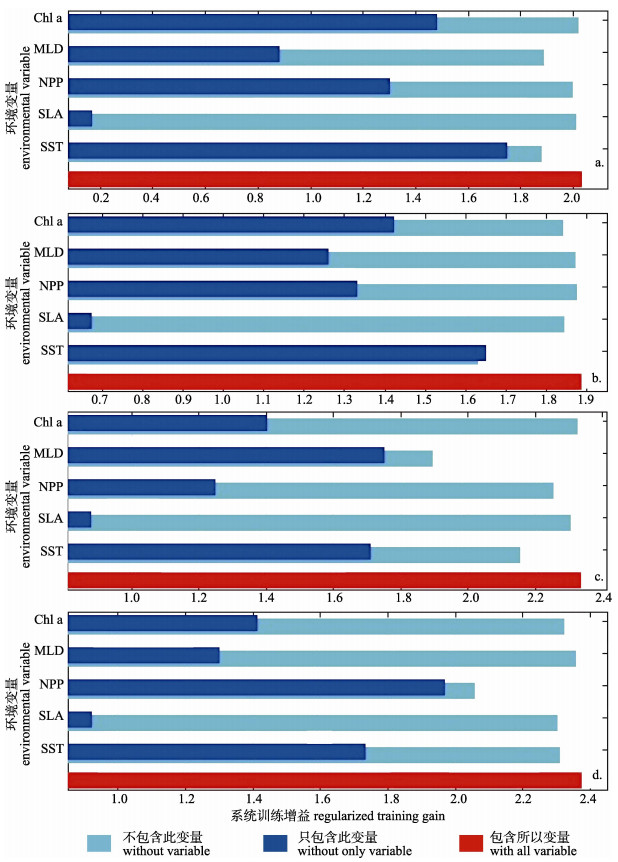
2011—2015年各月柔鱼潜在分布的MaxEnt模型中环境变量重要性刀切法结果显示(图 4), 7月和8月, 在仅包含单个因子获得的增益中, 仅包含SST时, 模型能获得最大增益, 不含SST时, 模型增益减少最大, 说明SST是影响7月和8月柔鱼潜在分布中的重要环境因子。9月, 当仅包含MLD时模型增益最大, 不包含MLD时模型增益减少最多, 其次是SST, 说明MLD和SST是影响9月柔鱼潜在分布中的重要环境因子。在10月, 当仅包含NPP时模型增益最大, 不包含NPP时模型增益减少最多, 其次是SST, 说明NPP和SST是影响10月柔鱼潜在分布中的重要环境因子。在所有的月份中, 相比于其他环境变量, 当仅包含SLA时, 模型增益最小, 说明SLA在各月模型模拟中对柔鱼潜在分布的影响最小。

|
图 4 2011—2015年7—10月柔鱼环境变量重要性刀切法结果 a. 7月; b. 8月; c. 9月; d. 10月. Fig.4 The results of the jackknife test of variable importance for Ommastrephes bartramii from July to October during 2011-2015 a. July; b. August; c. September; d. October. |
采用MaxEnt模型模拟西北太平洋柔鱼潜在栖息地分布精度非常高。基于模型模拟或预测精度, MaxEnt模型通常优于其他方法[17], 同时MaxEnt软件易于使用, 使MaxEnt软件包成为物种分布和环境生态位建模最广泛的工具之一。以往的研究中, 渔情分析通常使用基于渔业统计数据[7-9], 使研究局限于一定的时空范围内, 而MaxEnt模型适应于分布数据有限的物种, 只需获取物种出现点的位置信息和环境背景数据, 从而将研究者从判断不出现位点可靠性的困扰中解脱出来[18]。如该研究中尽管渔业数据采样范围35°N~50°N, 150°E~175°E, 而当环境背景数据范围有所扩大(35°N~50°N, 140°E~180°E)时, 同样可以模拟渔业采样范围以外的分布概率, 从研究结果可以看出(图 3), 在140°E~150°E以及175°E~ 180°E之间, 存在柔鱼最适宜区和较适宜区, 说明柔鱼可能分布于传统作业区域以外的海域, 这也验证了商业性渔业集中作业的特点, 导致在作业海域以外尽管可能有柔鱼存在但并未出现渔船作业的现象。
3.2 影响柔鱼分布的重要环境因子2011—2015年7—10月MaxEnt模型输出的刀切图结果显示(图 4), SST是各月影响柔鱼潜在分布的重要环境因子, 这与以往的研究结果类似[5, 19]。SST通常可作为西北太平洋海域寻找柔鱼渔场的指标[20], 陈新军等[21]利用SST和海表温水平梯度(the gradient of SST, GSST)建立HSI模型能够较好的预测柔鱼中心渔场, 因此SST不仅是模拟柔鱼潜在分布的重要环境因子, 同时也是寻找渔场以及预报中心渔场的重要指标。该研究结果同时表明, 各月影响柔鱼潜在分布的重要环境因子有所差异(图 4), 如在9月, MLD是MaxEnt模型模拟柔鱼潜在分布的重要环境变量(图 4), 从图 2可知, 9月柔鱼渔场平均MLD为(18.5±0.5) m, 以往的研究表明, 柔鱼倾向于出现在MLD较浅的海域, 最适宜MLD范围为15.5~18.5 m[22], 因此, 9月适宜的MLD可能为柔鱼营造了适宜的生存环境。在10月, NPP是MaxEnt模型模拟柔鱼潜在分布的重要环境变量(图 4), 从图 2可知, 10月柔鱼渔场平均NPP为(739.2±40.2) mg(C)/(m2·d), 以往的研究表明, NPP变化对柔鱼资源的空间分布和丰度大小具有调控作用[7], 因此, NPP在10月可能成为限制柔鱼分布的关键因子。各月MaxEnt模型模拟柔鱼潜在分布中, 当使用单变量构建的MaxEnt模型时, 使用SLA的模型输出增益明显低于使用其他变量的模型输出增益(图 4), 说明SLA对模型的贡献较小; 且在不包含SLA的模型输出增益与包含所有变量的模型输出增益基本一致, 说明SLA与其他环境因子可能存在交互作用, 因此在建立柔鱼分布模型时可以考虑忽略该因子。
3.3 不足与展望MaxEnt模型可以有效处理环境变量间的复杂交互关系[23], 因此该研究中并未考虑各环境变量的交互作用, 但这会给环境变量重要性评估方面带来困难, 故该研究仅分析了各月对模型影响重要的环境因子, 并未对环境变量的贡献率以及重要性排列进行深度分析。且由于影响物种分布的因子很多, 基于已有的数据构建的模型往往不能反映物种的生态本质, 甚至基础生态位[9, 24], 因此, 建议在今后的研究中应尽可能地将影响物种的潜在分布的环境因子考虑进来。此外, 针对在海洋环境中的物种建模中常见的数据质量和数量问题, 应尽可能选择适用于目标物种的分布模式, 由于模型的算法以及相对适宜性之间的差异, 有研究认为[25], 在采用不同的方法或模型进行模拟或预测时, 不建议使用统计数据比较模型和选择“最佳”模型, 建议采用多模式方法, 以尽量减少因数据和模型公示的不确定性造成的偏差。
| [1] |
Wang Y G, Chen X J. The resource and biology of economic oceanic squid in the world[M]. Beijing: China Ocean Press, 2005. [王尧耕, 陈新军. 世界大洋性经济柔鱼类资源及其渔业[M]. 北京: 海洋出版社, 2005.]
|
| [2] |
Chen X J, Zhao X H, Chen Y. Influence of El Ni?o/La Ni?a on the western winter-spring cohort of neon flying squid (Ommastrephes bartramii) in the northwestern Pacific Ocean[J]. ICES Journal of Marine Science, 2007, 64(6): 1152-1160. DOI:10.1093/icesjms/fsm103 |
| [3] |
Igarashi H, Ichii T, Sakai M, et al. Possible link between interannual variation of neon flying squid (Ommastrephes bartramii) abundance in the North Pacific and the climate phase shift in 1998/1999[J]. Progress in Oceanography, 2017, 150: 20-34. DOI:10.1016/j.pocean.2015.03.008 |
| [4] |
Chen X J, Cao J, Chen Y, et al. Effect of the Kuroshio on the spatial distribution of the red flying squid Ommastrephes bartramii in the Northwest Pacific Ocean[J]. Bulletin of Marine Science, 2012, 88(1): 63-71. DOI:10.5343/bms.2010.1098 |
| [5] |
Chen C S, Chiu T S. Abundance and spatial variation of Ommastrephes bartramii (Mollusca:Cephalopoda) in the eastern North Pacific observed from an exploratory survery[J]. Acta Zoologica Taiwanica, 1999, 10(2): 135-144. |
| [6] |
Ichii T, Mahapatra K, Sakai M, et al. Changes in abundance of the neon flying squid Ommastrephes bartramii in relation to climate change in the central North Pacific Ocean[J]. Marine Ecology Progress Series, 2011, 441: 151-164. DOI:10.3354/meps09365 |
| [7] |
Yu W, Chen X J, Yi Q, et al. Influence of oceanic climate variability on stock level of western winter-spring cohort of Ommastrephes bartramii in the Northwest Pacific Ocean[J]. International Journal of Remote Sensing, 2016, 37(17): 3974-3994. DOI:10.1080/01431161.2016.1204477 |
| [8] |
Cao J. Stock assessment and risk analysis of management strategies for neon flying squid (Ommastrephes bartramii) in the Northwest Pacific Ocean[D]. Shanghai: Shanghai Ocean University, 2009. [曹杰.西北太平洋柔鱼资源评估与管理[D].上海: 上海海洋大学, 2009.] http://www.wanfangdata.com.cn/details/detail.do?_type=degree&id=Y1821703
|
| [9] |
Tian S Q, Chen X J, Chen Y, et al. Evaluating habitat suitability indices derived from CPUE and fishing effort data for Ommatrephes bratramii in the northwestern Pacific Ocean[J]. Fisheries Research, 2009, 95(2-3): 181-188. DOI:10.1016/j.fishres.2008.08.012 |
| [10] |
Jiménez-Valverde A, Lobo J M, Hortal J. Not as good as they seem:The importance of concepts in species distribution modelling[J]. Diversity and Distributions, 2008, 14(6): 885-890. DOI:10.1111/j.1472-4642.2008.00496.x |
| [11] |
Yu W. Response mechanism of winter-spring cohort of neon flying squid to the climatic and environmental variability in the Northwest Pacific Ocean[D]. Shanghai: Shanghai Ocean University, 2016. [余为.西北太平洋柔鱼冬春生群对气候与环境变化的相应机制研究[D].上海: 上海海洋大学, 2016.] http://cdmd.cnki.com.cn/Article/CDMD-10264-1016912194.htm
|
| [12] |
Alabia I D, Saitoh S I, Mugo R, et al. Seasonal potential fishing ground prediction of neon flying squid (Ommastrephes bartramii) in the western and central North Pacific[J]. Fisheries Oceanography, 2015, 24(2): 190-203. DOI:10.1111/fog.12102 |
| [13] |
Kong W Y, Li X H, Zou H F. Optimizing MaxEnt model in the prediction of species distribution[J]. Chinese Journal of Applied Ecology, 2019, 30(6): 2116-2128. [孔维尧, 李欣海, 邹红菲. 最大熵模型在物种分布预测中的优化[J]. 应用生态学报, 2019, 30(6): 2116-2128.] |
| [14] |
Chen P, Chen X J. Analysis of habitat distribution of Argentine shortfin squid (Illex argentinus) in the southwest Atlantic Ocean using maximum entropy model[J]. Journal of Fisheries of China, 2016, 40(6): 893-902. [陈芃, 陈新军. 基于最大熵模型分析西南大西洋阿根廷滑柔鱼栖息地分布[J]. 水产学报, 2016, 40(6): 893-902.] |
| [15] |
Zhang L. Application of MAXENT model in predicting species potential distribution[J]. Bulletin of Biology, 2015, 50(11): 9-12. [张路. MAXENT最大熵模型在预测物种潜在分布范围方面的应用[J]. 生物学通报, 2015, 50(11): 9-12.] |
| [16] |
Phillips S J. A brief tutorial on Maxent[CP/OL]. http://biodiversityinformatics.amnh.org/open_source/maxent/.
|
| [17] |
Merow C, Smith M J, Silander J A Jr. A practical guide to MaxEnt for modeling species' distributions:What it does, and why inputs and settings matter[J]. Ecography, 2013, 36(10): 1058-1069. DOI:10.1111/j.1600-0587.2013.07872.x |
| [18] |
Li W Q, Xu Z F, Shi M M, et al. Prediction of potential geographical distribution patterns of Salix tetrasperma Roxb. in Asia under different climate scenarios[J]. Acta Ecologica Sinica, 2019, 39(9): 3224-3234. [李文庆, 徐洲锋, 史鸣明, 等. 不同气候情景下四子柳的亚洲潜在地理分布格局变化预测[J]. 生态学报, 2019, 39(9): 3224-3234.] |
| [19] |
Gong C X, Chen X J, Gao F, et al. Importance of weighting for multi-variable habitat suitability index model:A case study of winter-spring cohort of Ommastrephes bartramii in the northwestern Pacific Ocean[J]. Journal of Ocean University of China, 2012, 11(2): 241-248. DOI:10.1007/s11802-012-1898-6 |
| [20] |
Chen X J. An approach to the relationship between the squid fishing ground and water temperature in the Northwestern Pacific[J]. Journal of Shanghai Fisheries University, 1995, 4(3): 181-185. [陈新军. 西北太平洋柔鱼渔场与水温因子的关系[J]. 上海水产大学学报, 1995, 4(3): 181-185.] |
| [21] |
Chen X J, Liu B L, Tian S Q, et al. Forecasting the fishing ground of Ommastrephes bartramii with SST-based habitat suitability modelling in Northwestern Pacific[J]. Oceanologia et Limnologia Sinica, 2009, 40(6): 707-713. [陈新军, 刘必林, 田思泉, 等. 利用基于表温因子的栖息地模型预测西北太平洋柔鱼(Ommastrephes bartramii)渔场[J]. 海洋与湖沼, 2009, 40(6): 707-713. DOI:10.3321/j.issn:0029-814X.2009.06.006] |
| [22] |
Yu W, Chen X J, Yi Q, et al. Spatio-temporal distributions and habitat hotspots of the winter-spring cohort of neon flying squid Ommastrephes bartramii in relation to oceanographic conditions in the Northwest Pacific Ocean[J]. Fisheries Research, 2016, 175: 103-115. DOI:10.1016/j.fishres.2015.11.026 |
| [23] |
Elith J, Phillips S J, Hastie T, et al. A statistical explanation of MaxEnt for #cologists[J]. Diversity and Distributions, 2011, 17(1): 43-57. DOI:10.1111/j.1472-4642.2010.00725.x |
| [24] |
Wintle B A, McCarthy M A, Parris K M, et al. Precision and bias of methods for estimating point survey detection probabilities[J]. Ecological Applications, 2004, 14(3): 703-712. DOI:10.1890/02-5166 |
| [25] |
Jones M C, Dye S R, Pinnegar J K, et al. Modelling commercial fish distributions:Prediction and assessment using different approaches[J]. Ecological Modelling, 2012, 225: 133-145. DOI:10.1016/j.ecolmodel.2011.11.003 |
 2020, Vol. 27

